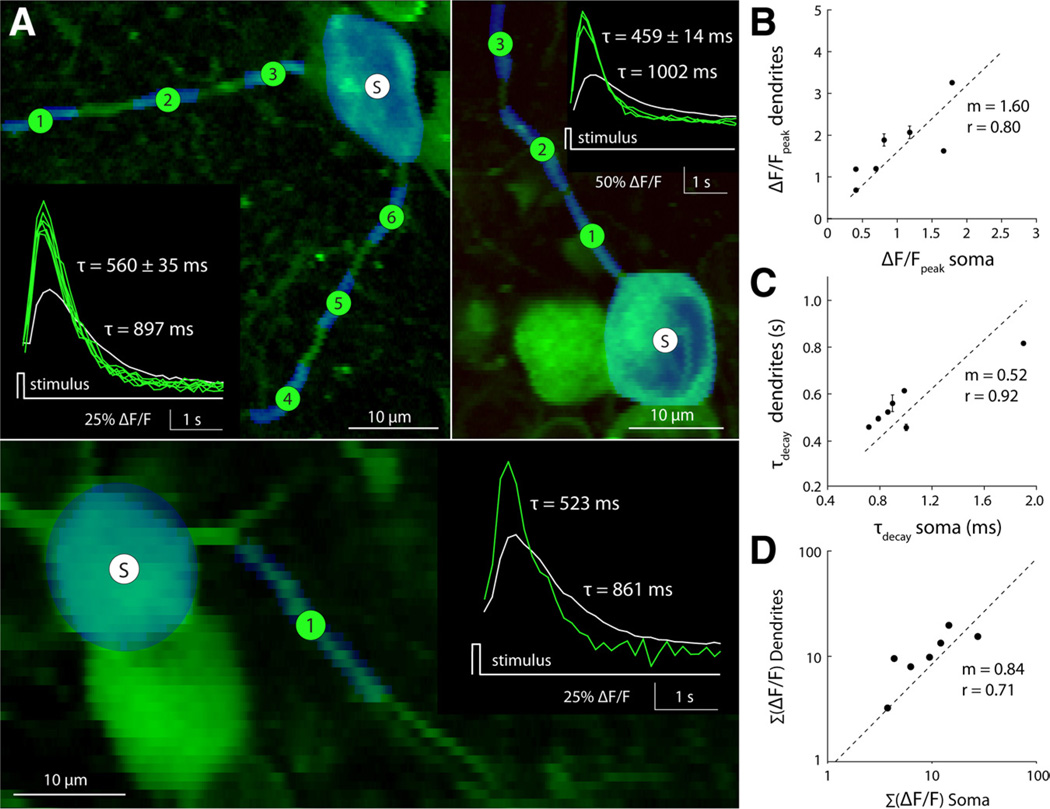
Figure 9. Calcium responses in dendrites are twofold larger and faster than in somas.
Light flash-evoked fluorescence responses measured in ganglion cells where soma and dendrites were visible in the same focal plane. A, Two-photon images of optically recorded neurons. Measured regions (ROIs) (see Materials and Methods) are shown in blue overlaid on the green fluorescence image. S, Soma; 1–6, dendritic segments. Inset, Fluorescence response for all ROIs (soma, white; dendrites, green). Curves show the fluorescence response after a brief light flash (full-field LED, 458 nm, 125 ms duration, 100 µW/cm2; >10 repeats). Decay time constants (τ) were calculated from a single exponential fit to each curve. Different panels represent different examples. B, C, Comparison of fluorescence response amplitude (B) and decay time constant (C) recorded simultaneously from the dendrites and soma of a ganglion cell (plot includes all data shown in A). D, Time integral of the stimulus evoked fluorescence response recorded in dendrites versus soma (n = 7 cells). B–D, Dotted line, Least-squares linear fit to the data, constrained to pass through the origin. m = fit slope; r values calculated from linear regression.

