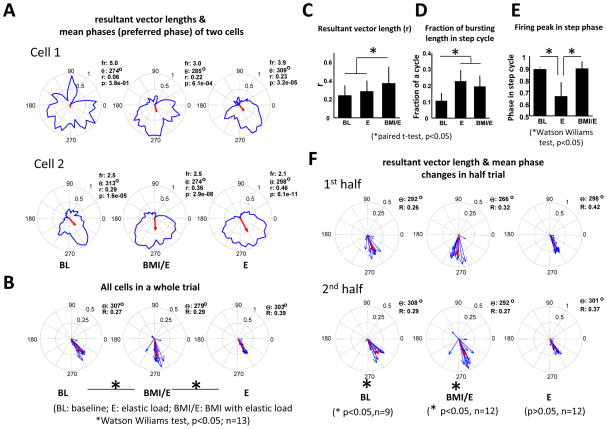
Figure 5.
Examples of single cell firing pattern in the step cycle in a session (same datasets as Fig.2 and 4). A. Cells changed firing patterns in different ways (fr: firing rate in spikes/s; r: resultant vector length; θ: mean phase of the firing rate; p: p-value of the non-uniformity Rayleigh test) under different conditions. Red arrow indicates the mean preferred firing phase and the resultant vector length. Cell 1 and Cell 2 show common patterns of increasing and changing phase modulations. B. The firing pattern of the ensemble of all cells (n=13) in a session. Cells showed different non-uniform discharge patterns in the different conditions (BL: 11; E: 12; BMI/E: 12). In the cell ensemble, there was a significant mean firing phase shift (non-uniform firing cells at each of the comparing conditions) between simple elastic load and either baseline or BMI with elastic load (Watson Wiliams test p<0.05, n=11). Red arrows indicate the mean of the ensemble preferred firing phase and the resultant vector length. C. For the same trial and population of cells (n=13), there was significant increase in the resultant vector length during BMI with elastic load compared with either baseline or simple elastics load conditions (paired t-test p<0.05). D. The fraction of the cycle with bursting was significantly increased during simple elastic load and BMI with elastic load condition compared with the baseline (paired t-test p<0.05). E. The mean phase of the firing peak in the step cycle was significantly different between simple elastic load compared to either baseline or BMI with elastic load conditions (Watson Wiliams t-test, p<0.05). F. Single cell firing patterns in step cycle during the first half and the second half of trial. Blue arrows indicate the mean preferred firing phase and the resultant vector length of each cell. There was no significant difference in resultant vector length between the first half trial and the second half trial, but there was significant difference in the mean preferred phase of the ensemble (red arrow) between first half trial and the second half trial during both baseline condition (p<0.05, n=9) and BMI with elastic load condition (p<0.05, n=12).

