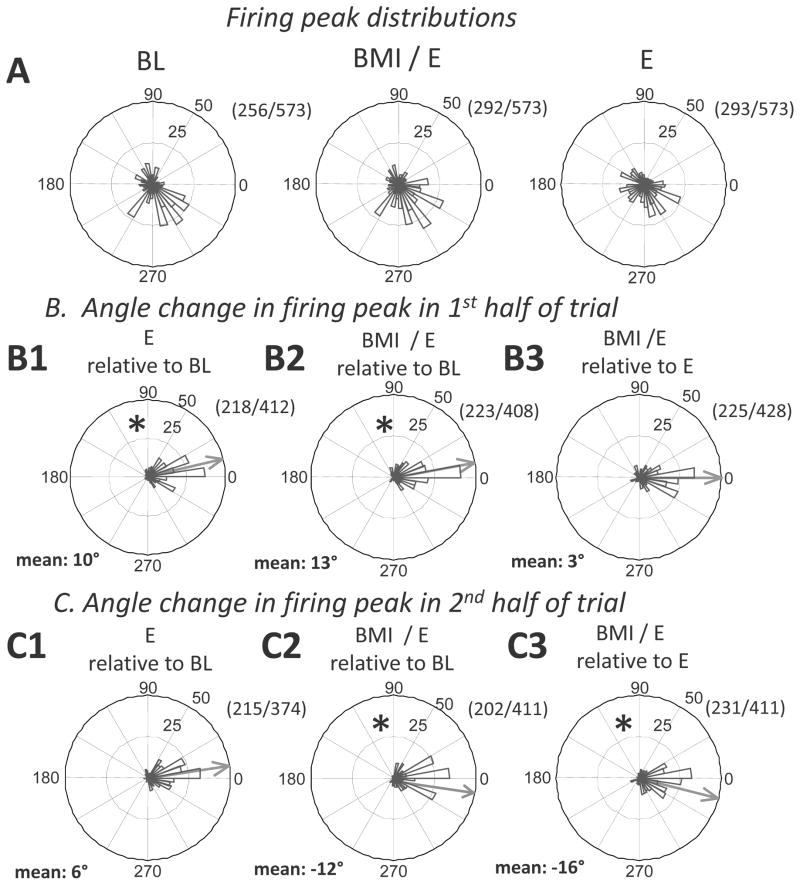
Figure 6.
Peak firing phases in the step cycle and peak firing phase changes during adaptations in the combined data from all rats. A. Distribution of non-uniformly firing cells peak firing. Some cells preferentially fired at particular step phases under different conditions (BL: 256; E: 292; BMI/E:293 of the total 573 cells, all with Rayleigh test, p<0.05). Among these, 216/573 showed non-uniform discharging in step cycle across all conditions, while 96/573 showed uniform discharging across all conditions. We subtracted peak phases of cells which showed non-uniform discharging between conditions to examine peak phase shifts, i.e., changes in peak phase angles between conditions in B and C. Thus 0 phase shift after subtraction indicates no change in peak phase. The numerator in the fraction number in each panel B and C was the number of cells shown nonuniform discharging at both conditions, denominator was the number at either conditions. B1–B3. Differences in cell peak firing phases in first half trial. Mean phase differences are shown by the grey arrow in each panel. In the first half trial, there were significant changes of firing peak phase between baseline and both simple elastic load (B1, * circular t-test, p<0.05) and BMI with elastic load (B2, * p<0.05), while there was no significant difference between simple elastic load and BMI with elastic load (B3, no phase shift, circular t-test, p>0.05). C1–C3. Differences in cell peak firing phases in second half trial. Mean phase differences are shown by the grey arrow in each panel. In the second half trial, there was no significant difference in the firing peak phases between simple elastic load and baseline (C1, no phase shift, circular t-test, p>0.05), but a significant difference persisted between BMI with elastic load and baseline (C2, * p<0.05), and between BMI with elastic load and simple elastic load (C3, * p<0.05). The data were consistent with a transient peak phase shift in simple elastic load condition and a longer term peak phase shift in firing in BMI with elastic load condition (* indicates circular t-test, p<0.05) which reversed compared to the initial changes (compare B2 and C2 measured relative to baseline).

