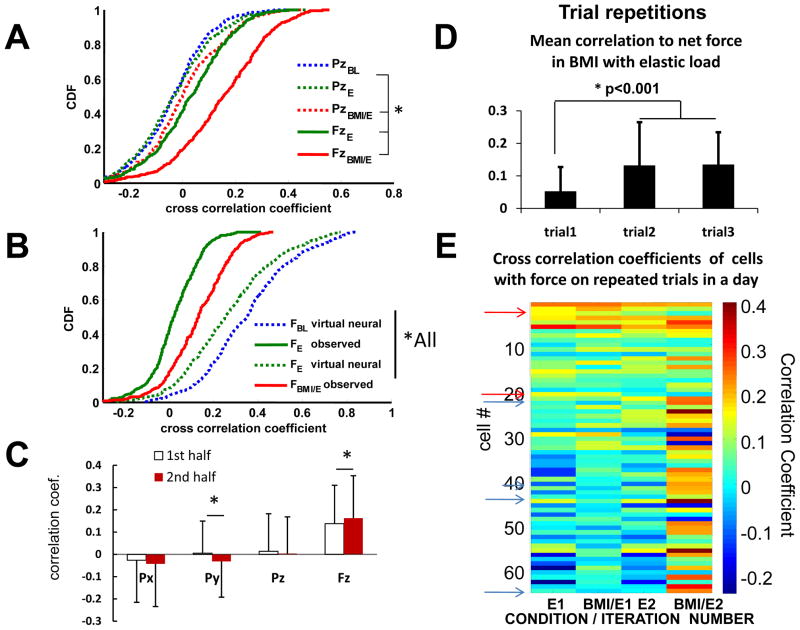
Figure 7.
Correlations of individual neural firing rates with kinematic and kinetic parameters examined at the whole population level (n=573). A. The correlation coefficients of cells’ firing rate with both vertical force (FzBMI/E) and vertical position (PzBMI/E) were significantly increased in BMI with elastic load (red) compared to simple elastic load (FzE and PzE) (green, * kstest2 p<0.05). Cells also tended to be more correlated with force (Fz) than with position (Pz) in both simple elastic load and BMI with elastic load conditions (* kstest2 p<0.05). The distribution of correlation coefficients between the robot position (Pz) and firing rate was notsignificantly different between baseline and simple elastic load (PzBL vs PzE kstest2 p>0.05). B, The distribution of correlation coefficients between firing rate and measured forces or derived forces (virtual forces) under different conditions: virtual force in baseline (FBL virtual neural), virtual neural driven resulting interaction force in simple elastic load (FE virtual neural) and real total interaction force in elastic load (FE observed) and real interaction force in BMI with elastic load (F BMI/E observed). All were significantly different (* kstest2 p<0.05). Correlations with virtual forces were much larger than actually observed. C, Changes in mean correlations with kinematic and force parameters in the BMI/E condition. In half trial comparisons, the correlation coefficient of firing rate with force was significantly increased from the first half trial to the second half trial in BMI/E, while other kinematics parameters were either not significantly different or significantly decreased, e.g., Py (*paired t-test, p<0.05). D. In 2 rats with multiple iterations of the baseline -> simple elastic load ->BMI with elastic load presentations in succession, the mean correlation of neurons to force was significantly altered between first and second iterations and then persisted in both rats (Data for a single rat also shown in E, t-test p<0.001). E. The correlation of neural firing to net force on the first and second iterations of presentations summarized as mean correlations in D. Note the general increase in BMI correlation over iterations. Some cells alter correlation sign between iterations with 2 marked on the figure changing from positive to negative (red arrows) and 4 from negative to positive (blue arrows).

