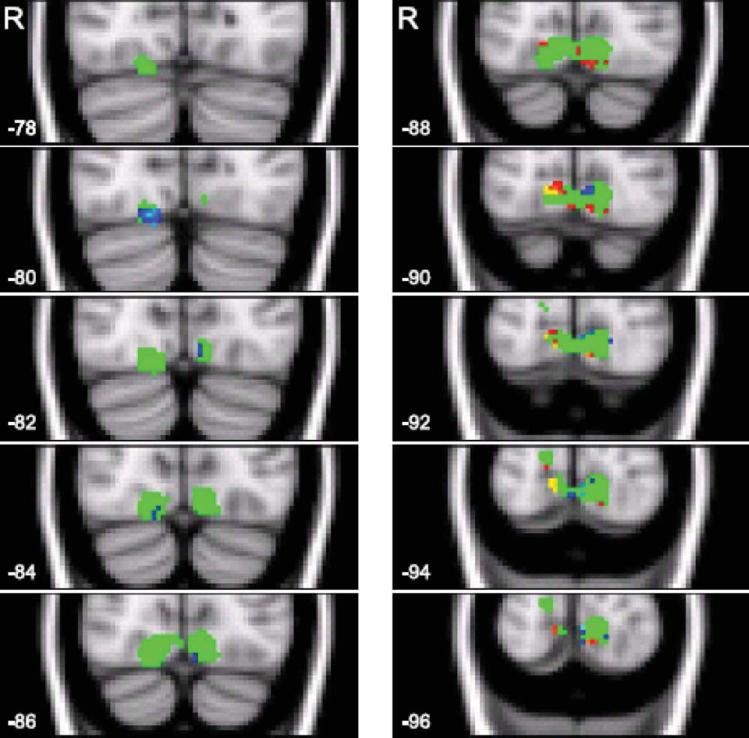
Figure 7.
The voxel sensitivities for occipital fusiform and lingual gyri reactivated in both groups of subjects. Ten consecutive axial slices (from –78 to –96 mm) are shown. The numbers in the left-lower corner of each image represent a slice coordinate along the y-axis. The letter “R” in the upper left corner stands for the right hemisphere. The region of interest is depicted in green color. Positive sensitivities are shown in red color. Negative sensitivities are shown in blue color.

