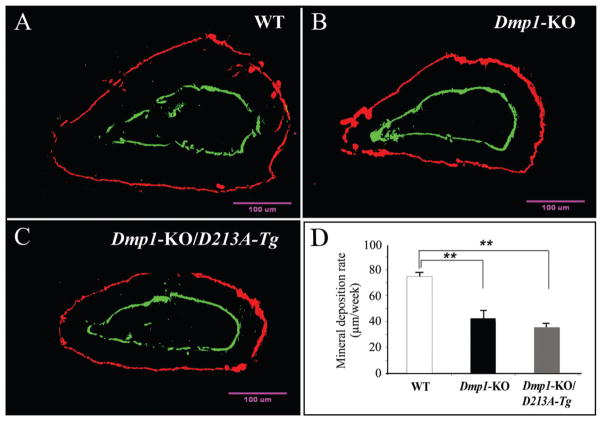
Figure 4.
Double fluorochrome labeling. The specimens were from the cross-section of incisors under the mesial root of the first molars of six-week-old mice: WT (A), Dmp1-KO (B), and Dmp1-KO/D213A-Tg (C). The labeling was viewed at higher magnification under a fluorescent microscope. We used the distance between these 2 fluorescence-labeled zones to calculate the dentin mineral deposition rate of the incisors. (D) The mineral deposition rate of dentin in the WT mice was significantly higher than that in the Dmp1-KO or Dmp1-KO/D213A-Tg mice. For each group, 4 measurements per tooth, n = 6 for each group. Data are expressed as mean ± SEM. **p < 0.01.

