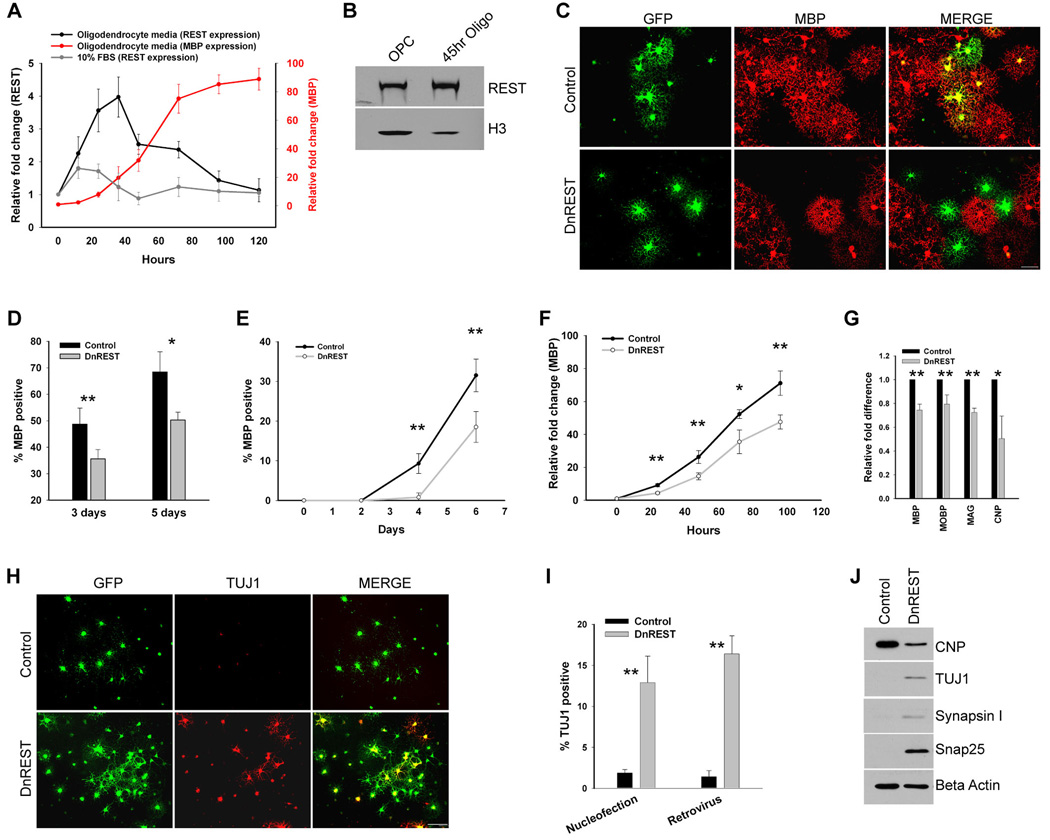
Figure 3. REST repression is necessary for proper oligodendrocyte maturation and to repress neuronal gene and protein expression in OPCs.
A. Real-time PCR of REST mRNA expression after the initiation of oligodendrocyte and 2A differentiation. Purified OPCs were switched to oligodendrocyte or 2A differentiation media at time 0 and total RNA was extracted at the indicated time points. mRNA expression is normalized to GAPDH and fold difference at each time point is relative to time 0. Error bars represent the standard deviation, n=3. B. Immunoblot analysis shows that REST protein levels increase during the onset of oligodendrocyte differentiation. Nuclear protein was isolated from OPCs in proliferation media and OPCs in oligodendrocyte media for 45hrs. Histone H3 is used as a loading control. C–D. Purified OPCs were co-nucleofected with a plasmid expressing GFP and either a plasmid expressing DnREST or an empty vector. C. Immunofluorescence staining for MBP (red) and GFP (green) 5 days post nucleofection. D. The percent of the nucleofected cells expressing MBP. Error bars represent the standard deviation, n=3, ** P value < .007, * P value <.02. E–J. OPCs were infected with control GFP or DnREST retroviruses as described under Materials and Methods and analyzed for the expression of properties associated with either mature oligodendrocyte (E–G) or immature neurons (H–J). E. Quantification of the percent of infected cells expressing MBP at the indicated time points subsequent to the initiation of oligodendrocyte differentiation. Error bars represent the standard deviation, n=3, ** P value < 0.001. F. Real-time PCR of MBP expression subsequent to the initiation of oligodendrocyte differentiation. Fold change is shown relative to time 0. n=3, * P value < 0.01, ** P value < 0.005. G. Real time PCR analysis of myelin gene expression after normalization to GAPDH. RNA was harvested 3 days after initiating oliodendrocyte differentiation. Error bars represent the standard deviation, n=6, *, P value < 0.05, **, P value < 0.001. H. Immunofluorescence staining for TUJ1 5 days post-induction. I. The percent of nucleofected or retroviral infected cells that express TUJ1. Error bars represent the standard deviation, n=3 for the nucleofection experiments, n=4 for the retroviral infection experiments, ** P value <0.0001. J. Immunoblot analysis of the expression of the indicated neuronal proteins 5 days post-infection for cells grown in oligodendrocyte media.

