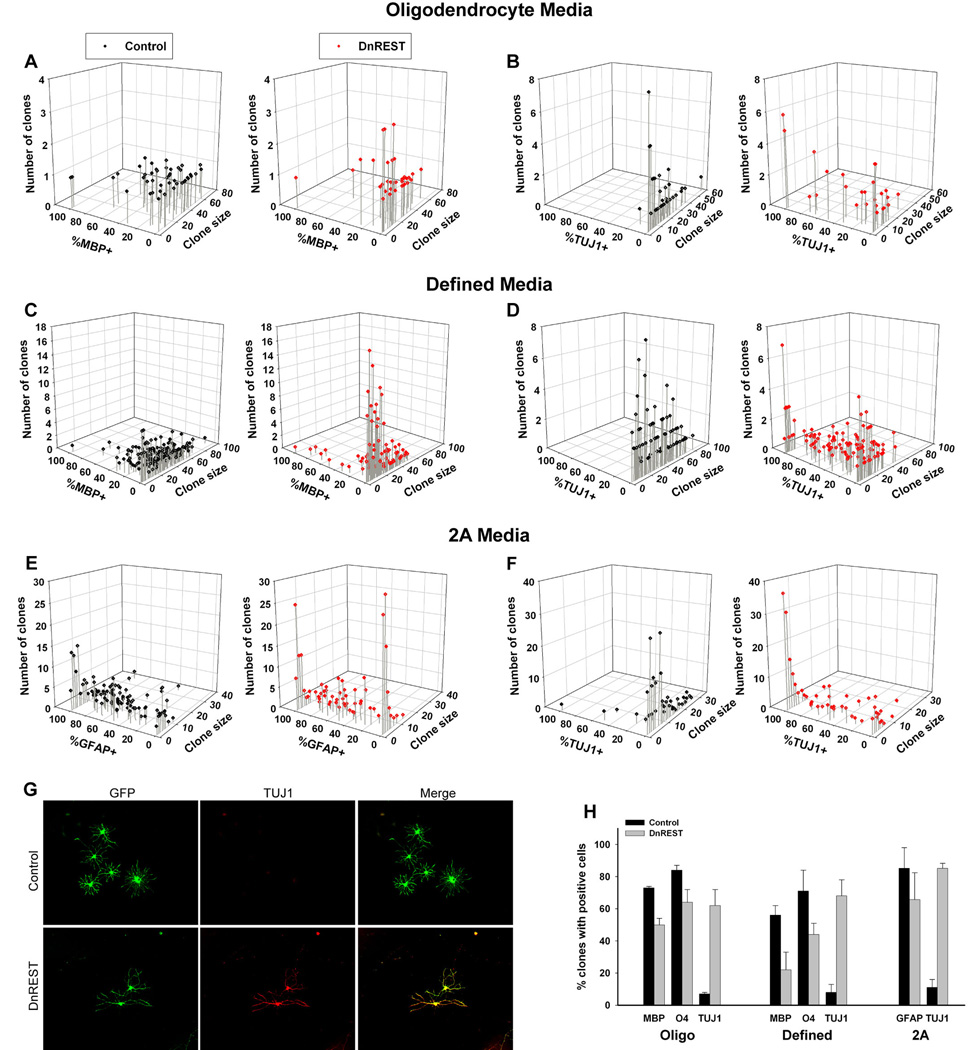
Figure 7. Clonal analysis of OPC differentiation.
OPCs were infected and grown at clonal density as described under Materials and Methods and analyzed for the expression of MBP, TUJ1, or GFAP after 5 days or O4 after 3 days in their indicated media. A–F. The scatter plots show the size and composition of all individual clones for the indicated growth conditions. G. Immunofluorescence staining for TUJ1 in a control and DnREST infected clone grown in 2A differentiation media for 5 days. H. The percent of clones containing cells positive for the indicated marker antigens. Total number of closed analyzed is given in the legend to Figure 6. P<0.05 for all pair-wise comparisons.

