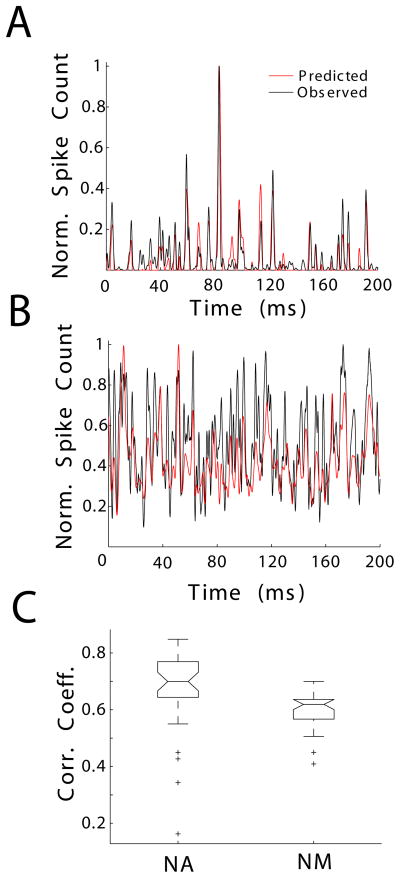
Figure 4.
STRFs more accurately predict the response of NA units than NM units. Example of observed (black) and predicted (red) PSTHs, given in units of normalized spike counts (Norm. Spike Count), from NA (A, correlation coefficient = 0.85) and NM (B, correlation coefficient = 0.7). (C) The correlation between the predicted and observed PSTHs (Corr. Coeff.) was compared across NA and NM. NA STRFs yielded better predictions of neural responses (medians significantly different by Kruskal-Wallis, p < 0.001). Boxes extend from lower quartile to upper quartile of the sample, with the center line marking the median. Outliers (+) are data points 1.5 times the interquartile range of the sample.

