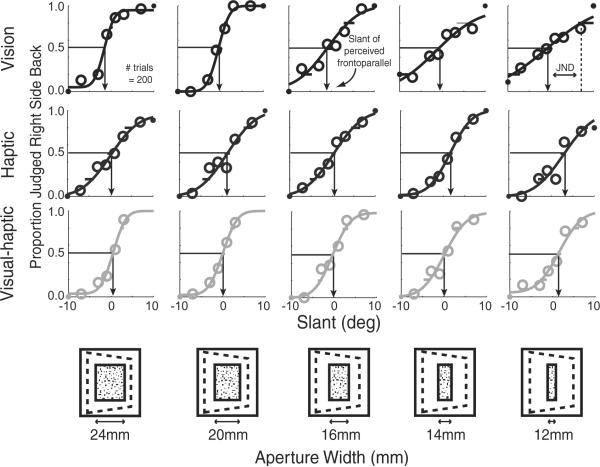
Figure 1.
Cue-combination data from one representative subject. Visual-alone, haptic-alone, and visual– haptic psychometric data are shown as a function of aperture width. The proportion of trials in which the slanted plane was perceived as right-side back from frontoparallel is plotted against the slant of the plane for visual-alone (top row), haptic-alone (middle row), and visual– haptic (bottom row) trials. The icons at the bottom depict how the variation of the width of the aperture through which the slanted planes were seen. Arrows indicate the slant that is perceived as frontoparallel. The JND is one SD from perceived frontoparallel; shallower slopes indicate larger JNDs.

