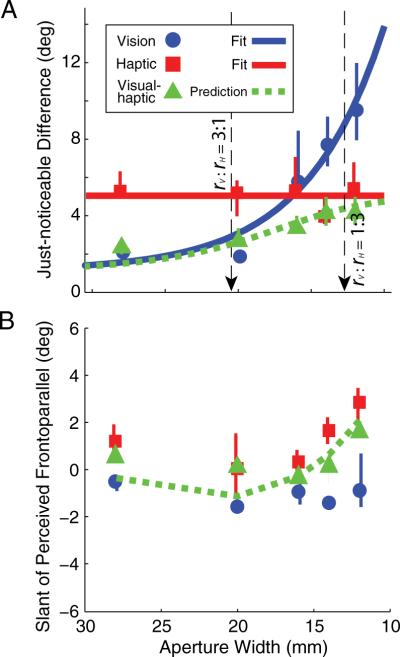
Figure 2.
Cue-combination results for one representative subject. A, Visual-alone slant discrimination thresholds (blue circles) decreased systematically as aperture width increased. As expected, haptic-alone discrimination thresholds (red squares) remained constant with aperture changes. The blue line is an exponential fit to the visual thresholds. The red line is a horizontal line fit to haptic JNDs. The black arrows mark aperture widths for which the ratios of visual and haptic reliabilities are 3:1 and 1:3 (for this subject: 20.5 and 12.6 mm, respectively). The visual– haptic thresholds (green triangles) and the reliability-based prediction for combined thresholds are also shown (green dashed line). The error bars are 95% confidence intervals. B, Visual-alone, haptic-alone, and visual– haptic slants of perceived frontoparallel. The green line is the zero-free-parameter reliability-based prediction of the visual– haptic slants of perceived frontoparallel based on the unimodal thresholds and unimodal slants of perceived frontoparallel. Across subjects, the visual bias was not significantly different from zero (t test, t(9) =−1.43, p = 0.19). The haptic bias was significantly different from zero (t test, t(9), 3.1372, p < 0.012, mean = 2.1°, CI = 0.58–3.59), although the change in bias with aperture size was not significant (ANOVA, F(1,9) = 1.66, p = 0.18). The haptic bias is presumably due to slight differences between the position tracked by the force-feedback device and the actual surface of the finger.

