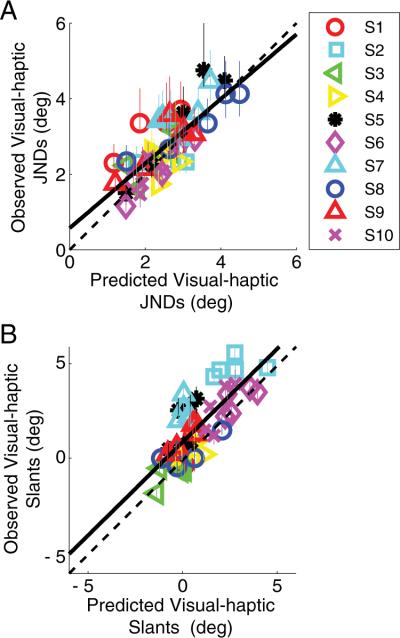
Figure 3.
Observed versus predicted data for the cue-combination study for all subjects. A, Observed JNDs plotted against predicted JNDs (R2 = 0.603). The solid black line is a linear regression to the data (y = 0.85x + 0.57). B, Slants that were perceived as frontoparallel plotted against the predictions. Subjects performed in a manner consistent with the predictions (R2 = 0.605). The solid black line is a linear regression to the data (y = 0.99x + 0.95). The positive shift of the predicted slants of perceived frontoparallel reflects the slight haptic bias.

