Figure 4.

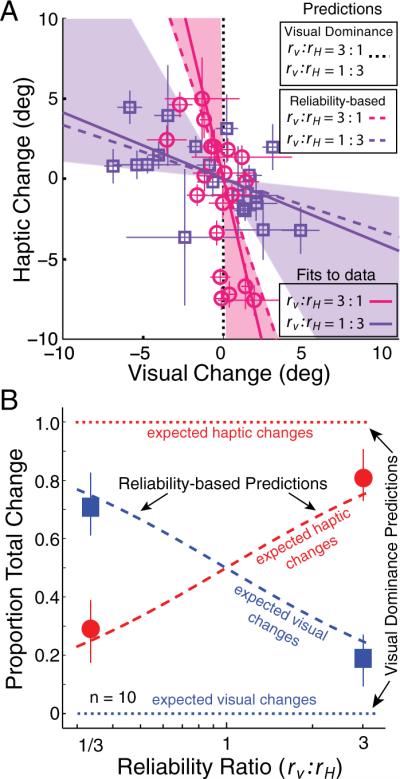
Adaptation predictions and data.A, Adaptation of each estimator in the conditions with high (magenta circles) and low visual reliability (purple squares). Each symbol represents the adaptation observed for one subject in one condition. The adaptation of each estimator was quantified as the difference between the preadaptation and postadaptation slants of perceived frontoparallel (PSEVPost − PSEVpre, PSEHPost − PSEHpre). Error bars on the data points represent ± 1 SD of this difference. The visual-dominance model predicts that all the data would lie on the vertical dotted line. The reliability-based model (Eq. 5) predicts that the data from the two reliability conditions will fall on the dashed purple (3 times more visual than haptic adaptation) and dashed magenta (1/3 times more visual than haptic adaptation) lines. The solid lines represent the best fits to the data that passed through zero. The shaded areas around the solid lines represent 95% confidence intervals for the best-fit lines from 1000 bootstrapped datasets. B, Group-average predictions and results. The average proportion of visual and haptic adaptation is plotted in the two reliability conditions: high and low visual reliability (rV:rH = 3:1 and rV:rH = 1:3, respectively). The horizontal dotted blue and red lines represent the visual dominance predictions for visual and haptic changes, respectively, as a function of reliability ratio. All of the change is predicted to be haptic, regardless of reliability ratio. The diagonal dashed blue and red lines show the predictions of the reliability-based model for visual and haptic changes as a function of reliability ratio. The blue squares and red circles represent the visual and haptic data. Error bars represent 95% confidence intervals computed from 1000 bootstrapped datasets.
