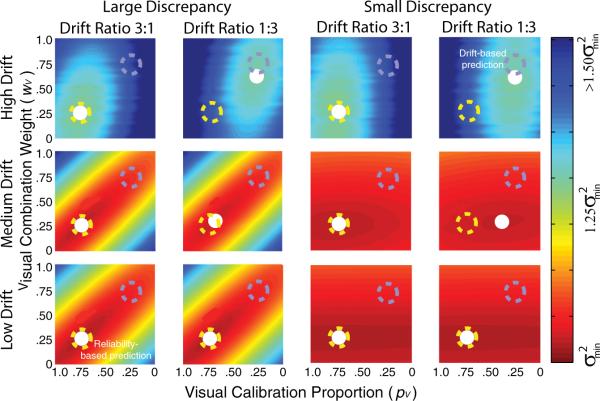
Figure 6.
Simulation results showing the variance of the combined estimate when the estimates undergo a random walk. The abscissa in each panel is the visual calibration proportion (pV) and the ordinate is the visual combination weight (wV). Color represents the variance of the combined estimate over time, dark red representing the smallest variance. The visual and haptic estimates were characterized by random walks with drifts of dV and dH. The recalibration rate was set with a Kalman filter. The estimator reliability ratio (rV:rH) was 1:3, as in the simulation in Figure 5. The top, middle, and bottom rows show the results when the drift magnitude, dV + dH, was large (), medium [], and small [], respectively. The two columns on the left show the results when the discrepancy introduced between the visual and haptic estimates was large(),and the two columns on the right show the results when the introduced discrepancy was small (). The first and third columns display the results when the drift ratio (dV:dH) was 3:1 and the second and fourth columns the results when the ratio was 1:3. The dashed yellow circles mark the predictions if minimum variance were determined by the reliability-based model (i.e., by the ratio of estimator reliabilities rV:rH); they are always at (0.75, 0.25) because the reliability ratio was always 1:3. The dashed blue circles represent the predictions if the minimum variance were determined only by the drift ratio dV:dH. The white circles indicate the calibration proportions and combination weights that yielded the combined estimate with the lowest variance.

