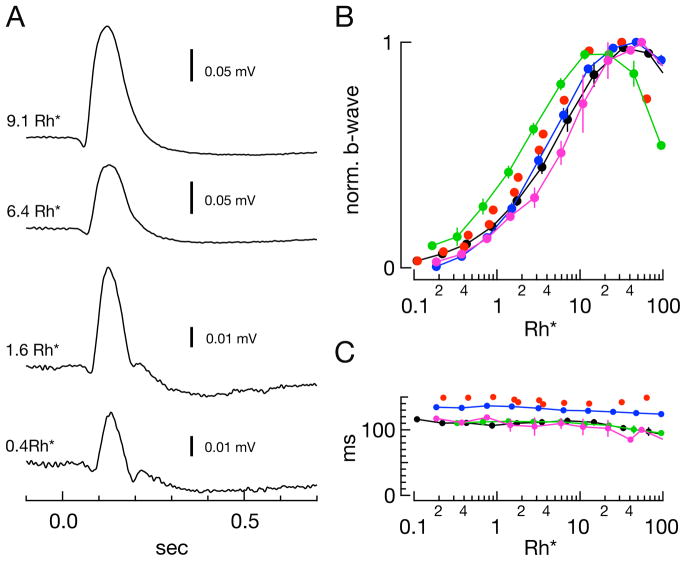
Figure 9. Properties of the in vitro scotopic ERG.
A) Example Ames’/Ames’ ERG traces at various flash strengths. B) Sensitivity of the b-wave amplitude across conditions for samples shown in Figure 8. Average half-saturating strengths in Rh*/rod: Locke’s/Locke’s (blue) - 3.2 Rh*/rod; Ames’/Ames’ (black) - 4.0 Rh*/rod; Ames’Ca,Mg/Ames’Ca,Mg (green) - 1.8 Rh*/rod; Ames’Mg/Ames’Mg (magenta) - 5.7 Rh*/rod. Red dots in (B) and (C) represent the b-wave amplitudes of the one sample recorded in L-15/Locke’s that exhibited a b-wave (Fig. 8H, top family). Half-saturating flash strength for this sample was 2.8 Rh*/rod. C) Average time-to-peak of the b-wave across conditions and flash strength for samples shown in Figure 8.

