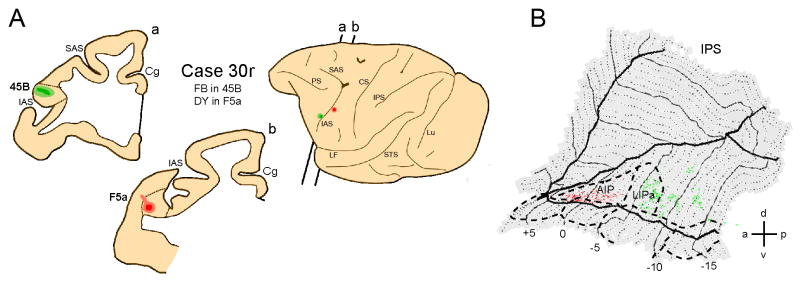
Figure 11. Distribution of labeling in IPS following tracer injection into premotor area F5a and prefrontal area 45B.
A. Location of the injection sites in F5a and 45B shown on the lateral view of the hemisphere and in two coronal sections (a,b). B. Distribution of retrograde labeling in IPS, overlaid onto a flat-map of the IPS. Red color shows IPS labeling following F5a injection, green color shows IPS labeling pattern following injection into area 45B.

