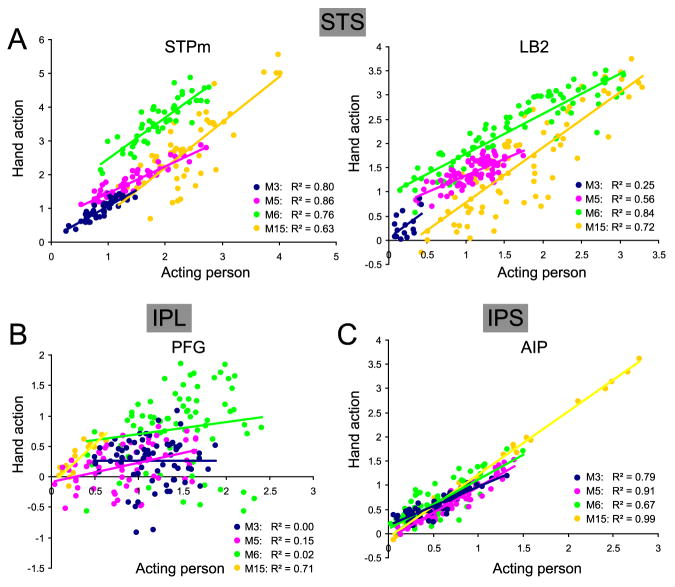
Figure 12. Heterogeneity of voxels within ROI for acting person and isolated hand action observation.
A. Correlation between functional MRI activations for observing acting persons and isolated hand actions in STPm (left) and LB2 (right). Percent MR signal change values for observation of acting person and hand action (versus fixation-only baseline) are plotted from all voxels within ROI responding to acting person. Different colors correspond to 4 different monkeys (M3, M5, M6 and M15). Regression lines for different subjects in STPm: M3, y = 0.97× + 0.11; M5, y = 0.79× + 0.67; M6, y = 1.22× +1.26; M15, y = 1.35× − 0.50, and in LB2: M3, y = 1.14× + 0.06; M5, y = 0.68× + 0.66; M6, y = 0.83× +0.96; M15, y = 1.14× − 0.36. All correlations were significant at p<10-6, except that in LB2 of M3 (p<0.06). B. Correlation between functional MRI activations for observing acting persons and isolated hand actions in PFG. Same conventions as in A. Regression lines for different subjects: M3, y = 0.001× + 0.26; M5, y = 0.31× - 0.08; M6, y = 0.20× + 0.50; M15, y = 1.31× − 0.11. Correlations were significant at p<0.001 in M5 and M15 but were non-significant (p>0.05) in M3 and M6. C. Correlation between functional MRI activations for observing acting persons and isolated hand actions in AIP. Same conventions as in A. Regression lines for different subjects: M3, y = 0.79× + 0.18; M5, y = 1.07× - 0.10; M6, y = 1.03× + 0.09; M15, y = 1.30× − 0.08. All correlations were significant at p<10-6. The differences in the degree of correlation between STPm and PFG were significant at p<0.01 in M3, M5 and M6, and between PFG and AIP at p<0.002 in the same three animals.

