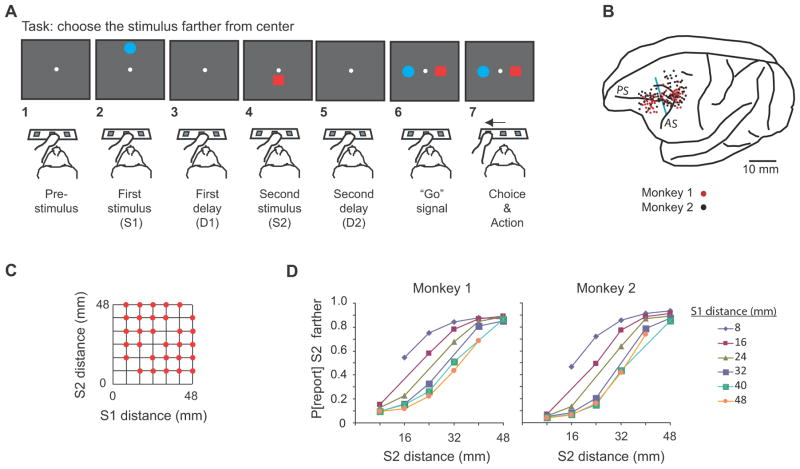
Figure 1.
Task, recording locations, distances used, and discrimination behavior. (A) Sequence of task events. Each gray rectangle represents the video screen. (B) Penetration sites. Composite from both monkeys, relative to sulcal landmarks. Vertical blue line: division between periarcuate (right) and dorsolateral prefrontal (left) areas. Abbreviations: AS, arcuate sulcus; PS, principal sulcus. (C) Stimulus locations. (D) Psychometric curves showing the probability of reporting (P[report]) that S2 was farther as a function of S2 distance.

