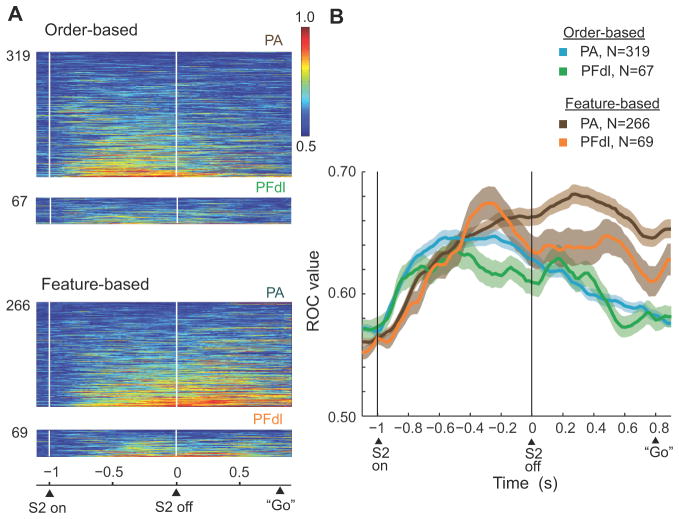
Figure 10.
Results of ROC analysis. Bin 200 ms, with 20 ms steps.(A) ROC plots for neurons with significant relative-distance coding, with the area under the ROC curve color-coded for each cell and ranked according to mean ROC values. (B) Time course of changes in mean ROC values. Background shading: one SEM. Only trials with an 800 ms D2 period were used.

