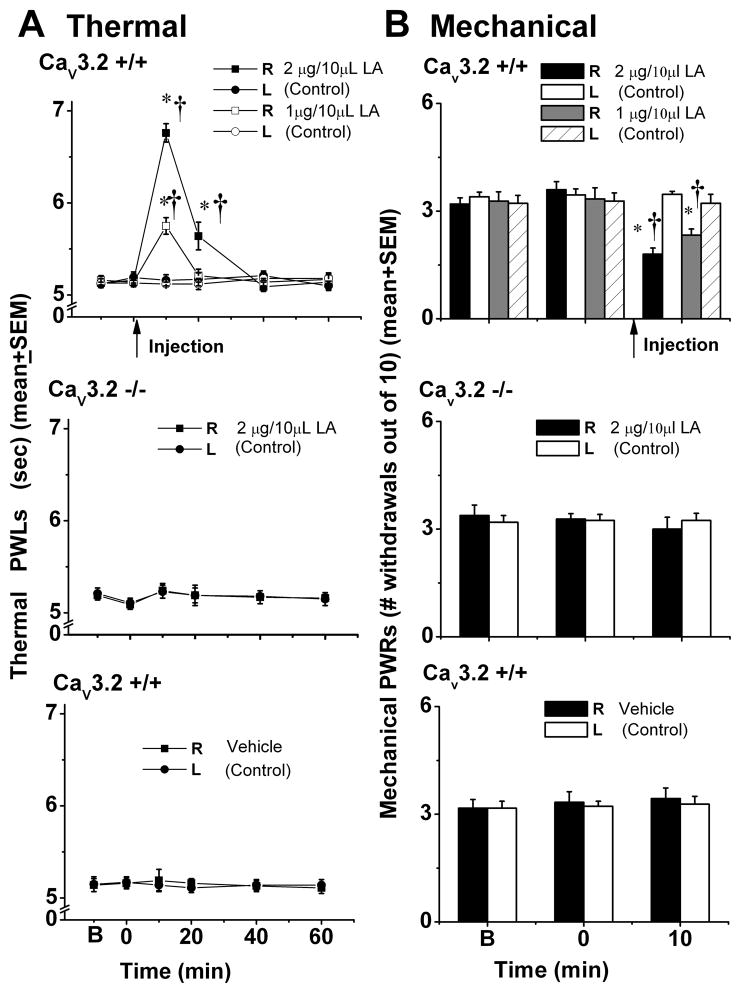
Figure 7. Intraplantar injections of LA in vivo decreased sensitivity to noxious thermal (A) and mechanical (B) stimuli in wild-type but not CaV3.2 KO mice.
A. The top panel indicates that LA at 1 μg/10μL (solid square symbols, n = 6) and 2 μg/10μL (open square symbols, n = 5) at 10 min after injection in the right paws of CaV3.2+/+ littermates increased average thermal (PWLs) (in sec) from control (left, uninjected paws, round symbols) by about 5.1 to 5.7 and 6.8 sec, respectively. Note that the effect is transient; PWLs returned to baseline levels at 40 and 60 min after intraplantar applications of LA. The middle panel shows the lack of effect of LA on the thermal sensitivity of CaV3.2−/− mice when injected into hind paws at a dose of 2 μg/10μL (n = 6). The lower panel shows the lack of effect of 0.19% ethanol injections (n = 5) on thermal PWLs in CaV3.2+/+ mice. As in the middle panel, PWLs remained stable in both right (injected paws, square symbols) and left (uninjected paws, round symbols) throughout testing.
Solid arrow indicates times of injection in all three panels. Symbol * indicates p < 0.001 for right versus left paw; Symbol † indicates p < 0.001 for pretreatment versus posttreatment at 10 and 20 min.
B. The top panel indicates that LA at 1 μg/10μL (gray filled column, n = 6) and 2 μg/10μL (black filled column, n = 5) at 10 min after injection in the right paws of CaV3.2+/+ littermates decreased average mechanical PWRs from control (left, uninjected paws, open columns) by about 28% and 48%, respectively. The middle panel shows the lack of effect of LA on the mechanical sensitivity of CaV3.2−/− mice when injected into hind paws at a dose of 2 μg/10μL (n = 6). The lower panel shows the lack of effect of 0.19% ethanol injections (n = 6) on mechanical PWRs in CaV3.2+/+ mice. As in the middle panel, PWRs remained stable in both right (injected paws, black filled columns) and left (uninjected paws, open columns) throughout testing. Solid arrow indicates times of injection in all three panels. Symbol * indicates p < 0.001 for right versus left paw; Symbol † indicates p < 0.05 for pretreatment (B and 0 minutes) versus posttreatment at 10 min.

