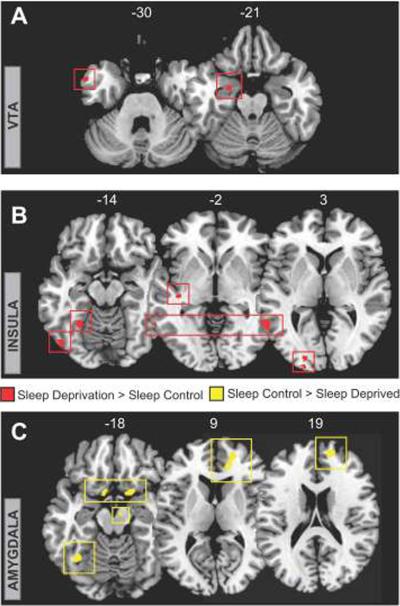
Figure 5.
Group-level differences in functional connectivity. Regions showing significantly greater functional connectivity (red with red box surround) in the sleep deprivation group relative to the sleep control group for ROIs (A) the VTA (seed), in the left anterior temporal pole (MNI peak: −57, 6, −30; Z score=3.74) left amygdala (peak: −24, −6, −24; Z score=3.93) and (B) the Insular (seed), in the left lateral occipital cortex (peak: −48, −75, −9; Z score=3.63), medial fusiform gyrus (peak: −27, −54, −15; Z score=3.98), posterior insular cortex (peak: −39, −24, −3; Z score=4.02), posterior middle temporal lobe (peak: −63, −54, 3; Z score=3.88), and left occipital cortex (peak: −21, −102, 3; Z score=3.82). (C) Regions showing significantly less functional connectivity (yellow with yellow box surround) in the sleep deprivation group relative to the sleep control group for bilateral amygdala ROIs in (left seed) the left orbitofrontal cortex (peak: 18, 9, −18; Z score=4.12) right orbitofrontal cortex (peak: −9, 6, −15; Z score=3.51), medial prefrontal cortex (peaks: 15, 54, 18; Z score=4.02; 21, 51, 6; Z score=3.71; 15, 39, 9; Z score=3.42), left Fusiform gyrus (peak: −36, −57, −18; Z score=3.72), and (right seed) the midbrain (peak: 9, −12, −18; Z score=3.35). Images are displayed in neurological convention on T1 anatomical axial slices (MNI slice number above), with left side corresponding to left hemisphere.

