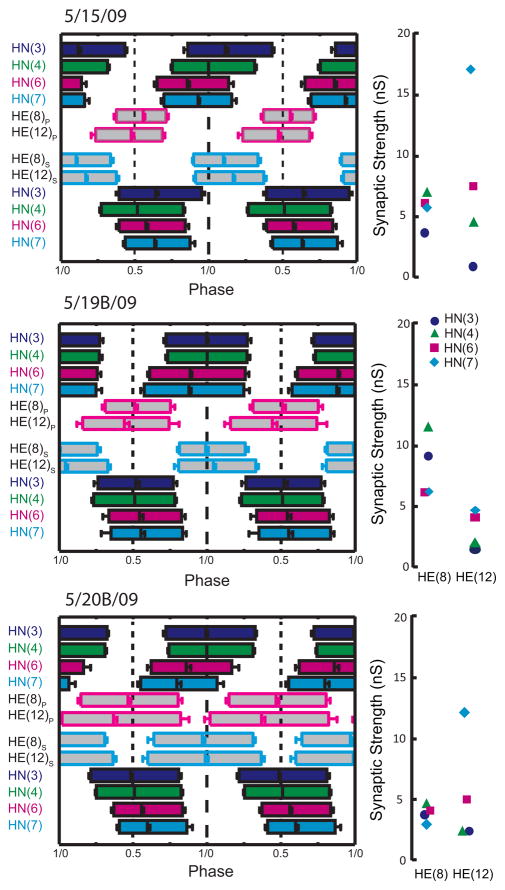
FIG. 8.
Complete analysis of input and output temporal patterns and synaptic strength patterns (spatial pattern) for 3 different preparations from our sample of 12 (summarized in Fig. 7). Temporal patterns were determined as in Figure 6 but the two ipsilateral phase diagrams were fused into a composite for ease of presentation. The strength pattern of the inputs, determined as in Figure 3, is shown to the right of each composite phase diagram. Standard colors and symbols are used throughout. Preparations are specified by the day on which they were recorded: letters accompany the day designation if more than one preparation was recorded on that day.

