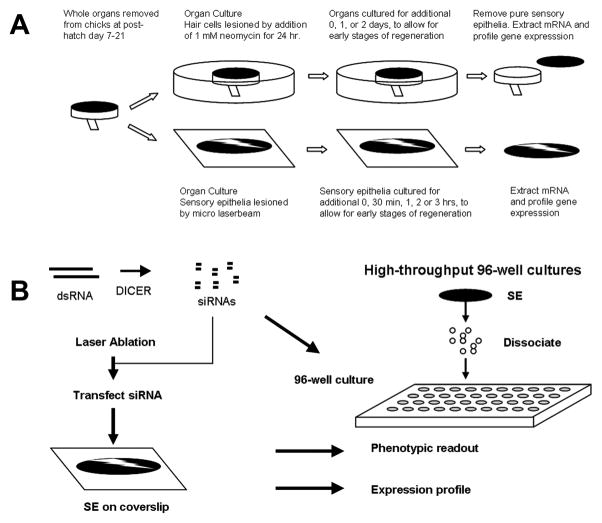
Figure 1.
Experimental Design. Flow diagram of experimental design scheme for time course profiling in the utricle and cochlea SE and RNAi profiling. (a) Time course of laser and neomycin recovery (b) TFs revealed in the time course of recovery were targeted by siRNA to assess a proliferation phenotype and expression profiled to evaluate knockdown of the target gene and potential epistatic relationships between TF’s.

