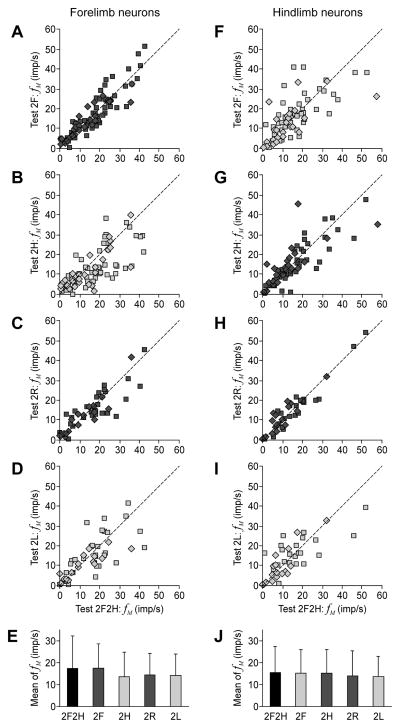
Figure 7. Mean discharge frequency of neurons in different locomotor tasks.
A–D, F–I: The scatter plots for the mean frequency fM in different bipedal walking tests plotted against the control Test 2F2H., for the forelimb and hindlimb neurons, correspondingly. Squares indicate the data points for PTNs, diamonds – for non-identified neurons. E, J: The population average (±SD) of the mean frequency (Mean of fM) in different tests, for the forelimb population of neurons (E) and for the hindlimb population (J). The averages were calculated together for PTNs and non-identified neurons. The columns for the control test are colored black. The dots and columns for the tests in which the own limb was walking are colored dark gray. The dots and columns for the tests in which the own limb was standing are colored light gray. The number of forelimb neurons in different tests: n=74 (2F2H), n=74 (2F), n=74 (2H), n=47 (2R), n=47 (2L). The number of hindlimb neurons in different tests: n=64 (2F2H), n=64 (2F), n=64 (2H), n=39 (2R), n=39 (2L).

