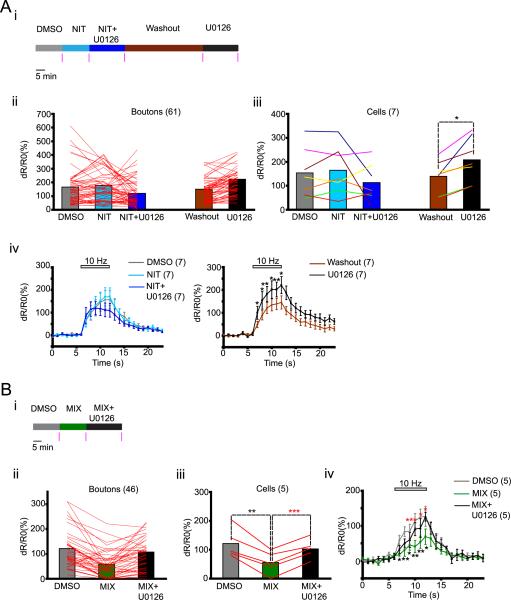
Figure 5.
U0126 increases calcium influx in axons through L type calcium channels. (A) Testing the effect of L type calcium channel blocker NIT. (B) Testing the effect of N, P/Q and R type calcium channel blockers MIX. ((A–B) (i) Experimental scheme for drug treatment. Pink vertical bars indicate times of imaging. (ii – iii) Lines connect [FRET ratio]4–6 from individual boutons (ii) and averages for individual cells (iii). Colors of lines represent individual cells (iii). (iv) Dynamics of dR/R0 (%) before (0 – 6 seconds), during (6 – 12 seconds) and after (12 – 23 seconds) stimulation. Data points are separated by 1 second. Horizontal bar on top of the graphs show duration of electrical stimulation. Number of cells/boutons is shown in parentheses. Data are presented as means ± S.E.M. * p<0.05, ** p<0.01 compared to corresponding values obtained with DMSO. * p<0.05, *** p<0.001 compared to the corresponding values obtained with MIX.

