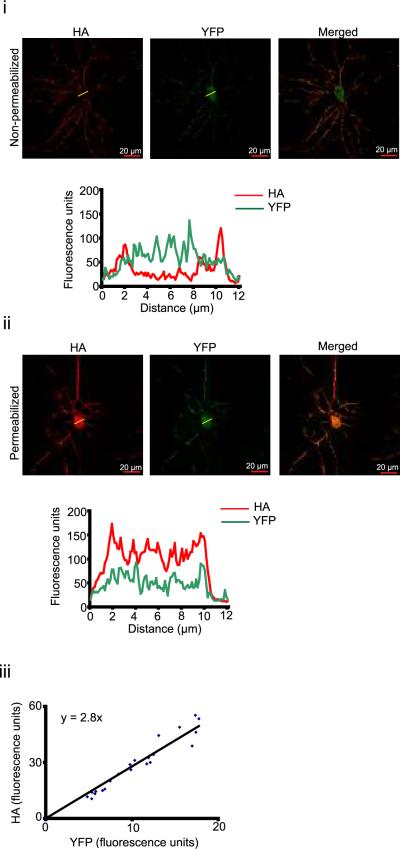
Figure 8.
Estimating surface fraction of L type calcium channels (i – ii) Top: Example HA antibody staining (left) and YFP fluorescence (middle) from non-permeabilized (i) or permeabilized (ii) neurons expressing YH-Cav1.2. Merged images are shown on right. Bottom: Corresponding line scan (yellow line in top panel) profiles. (iii) Linear regression of relationship between HA and YFP fluorescence.

