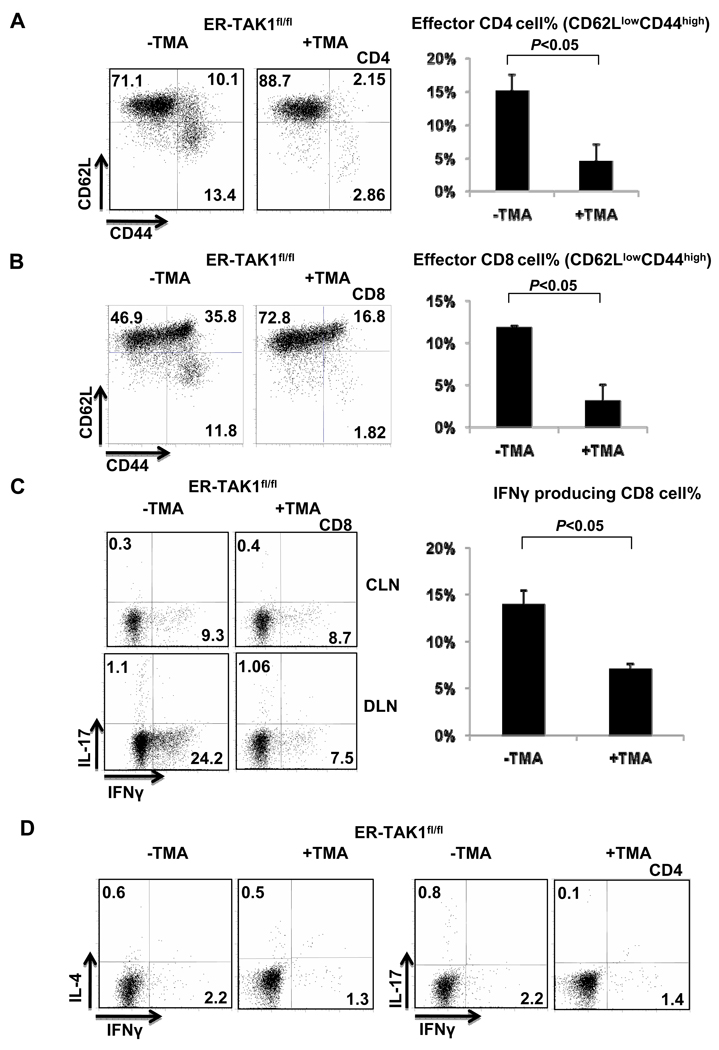
Figure 3. Lack of activation and cytokine production of CD4 and CD8 T cells in tamoxifen treated ER-TAK1fl/fl mice.
Flow cytometry analysis of CD62L and CD44 expression on CD4 (A) and CD8 (B) T cells in DLN of indicated mice 48 hours after challenge (left panels). The percentages of CD62Llow CD44high effector T cell population were plotted (right panels). Mean values of four mice ±SD are shown and the P value is indicated. (C) IFN-γ and IL-17 production by CD8 cells in the DLN of indicated mice (left panels). The frequencies (%) of IFN-γ producing CD8 cells from results of four independent experiments were plotted. Mean values ±SD are shown and the P value is indicated. (D) IFN-γ, IL-4 and IL-17 production in CD4 cells from DLN of indicated mice were detected by intracellular staining. Representative results of four independent experiments are shown.

