Figure 3.
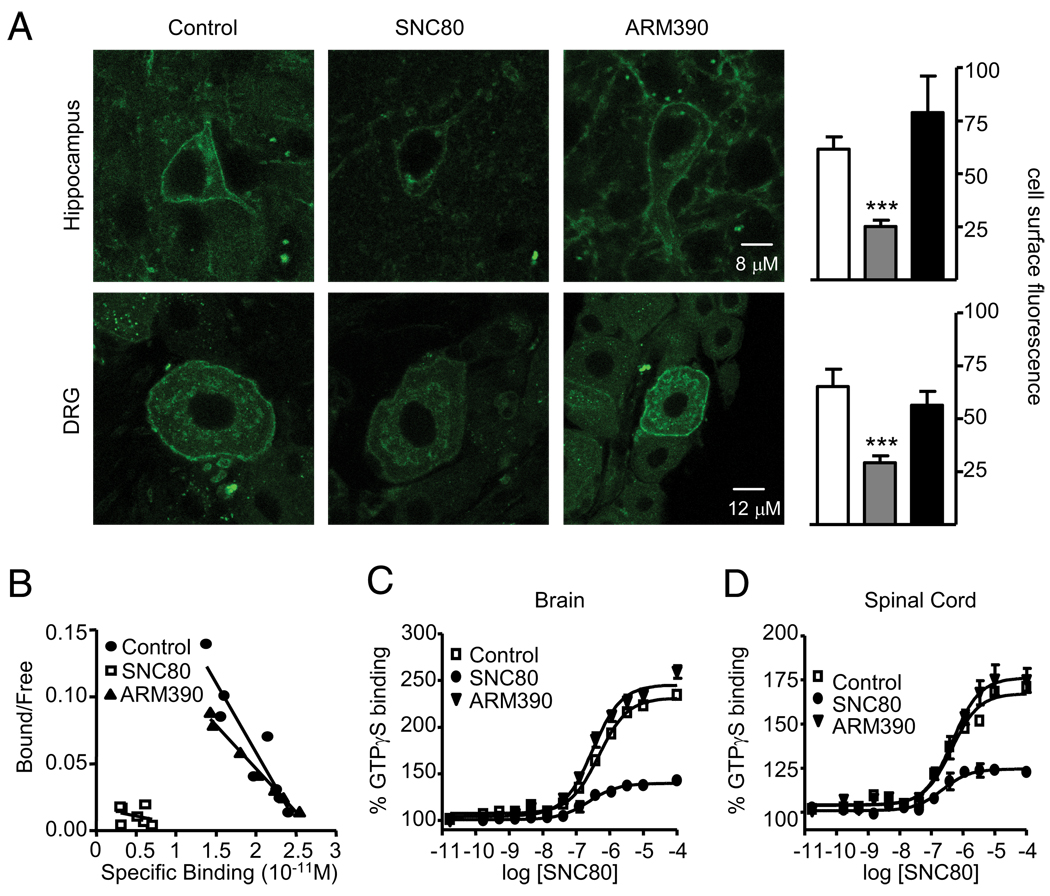
Chronic SNC80 and ARM390 produce distinct adaptive responses at the receptor level. A, Subcellular DOR-eGFP localization. Brain and dorsal root ganglia were analyzed 24 h after the last drug treatment (day 6) by confocal microscopy, and representative images are shown. Mean cell surface fluorescence was quantified in 3–4 sections per region per mouse. White bars, control group; gray bars, SNC80 group; black bars, ARM390 group; ***p < 0.001, one-way ANOVA, n = 3–4 mice/group. Both SNC80 and ARM390 animals show surface fluorescence, but the signal is significantly reduced in the SNC80 group. B, Scatchard plot of [3H]naltrindole saturation binding performed on brain membranes. Experiments were performed in triplicate; n = 3–5 mice/group. Kd (nm) and Bmax (pmol/mg) values were comparable for control (0.13 ± 0.004 nm, 0.20 ± 0.02 pmol/mg) and ARM390 (0.10 ± 0.006 nm, 0.20 ± 0.03 pmol/mg) groups, while specific binding was undetectable in the SNC80 group. C,D, SNC80-induced [35S]GTPγS binding in brain (C) or spinal cord (D) membrane preparations. The y-axis shows mean ± SEM specific [35S]GTPγS binding expressed as percentage basal binding (i.e., absence of agonist). n = 3 mice/group. For brain, EC50 (nm) and Emax (percentage basal) values are comparable for control (466 ± 1.1 nm, 231 ± 3.3%) and ARM390-tolerant (302 ± 1.1 nm, 245 ± 3.5%) groups, while [35S]GTPγS binding was strongly attenuated (239 ± 1.3 nm, 140 ± 1.5%) in the SNC80-tolerant group. Similar results were observed in the spinal cord. EC50 and Emax values were as follows: control, 433 ± 1.2 nm, 167.4 ± 1.9%), ARM390-tolerant group (455 ± 1.2 nm, 176.2 ± 2.8%), and SNC80-tolerant group (220 ± 1.4 nm, 124.6 ± 1.4%). Chronic SNC80 produces DOR-eGFP receptor downregulation, while ARM390 leaves receptors at the cell surface.

