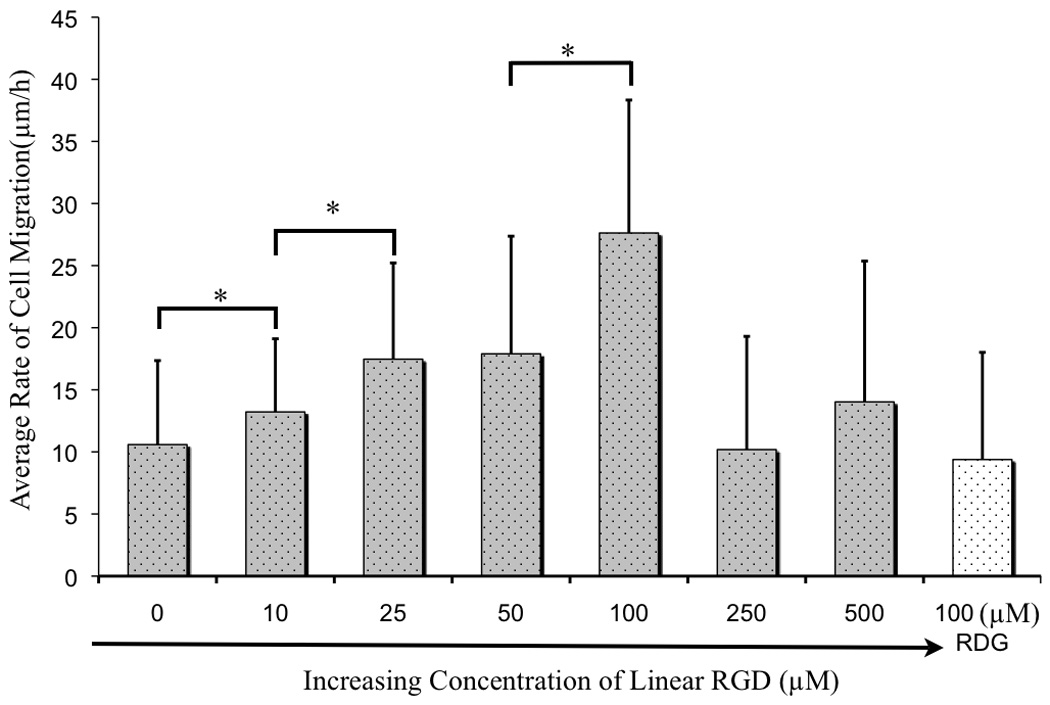
Figure 3.

A comparison of the rates of cell migration in the presence of soluble peptide in concentrations ranging from 0 to 500 μM. Values represent the mean rate of migration with error bars determined from the standard deviation. The statistical significance of the differences in rate was determined for the following concentrations of soluble peptide: 0–10 μM (*P<0.05), 10–25 μM (*P<0.05) and 50–100 μM (*P<0.05) concentration. No statistical significance was seen between 25–50 μM (P > 0.05). At 250 μM and 500μM concentration of linear RGD inhibition of cell adhesion was observed.
