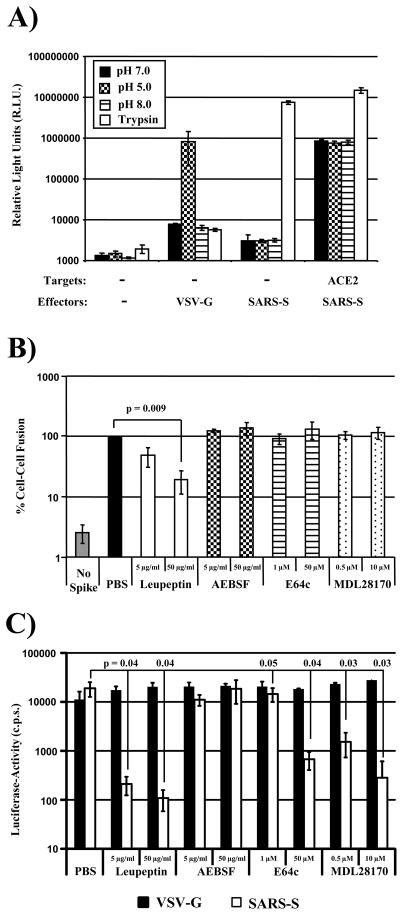
Fig. 9.
SARS-S-dependent cell-cell fusion depends on the activity of a cysteine or serine protease. (A) Target 293T cells cotransfected with a plasmid encoding β-galactosidase ω fragment and either pcDNA3 (control) or plasmid encoding ACE2 were mixed with 293T effector cells transiently expressing β-galactosidase α peptide in combination with either the SARS-S or VSV-G proteins. After one hour, cells were pulsed with different pH’s or TPCK-trypsin. After a further five hours, β-galactosidase trans-complementation was assessed and expressed as relative light units. The results of a representative experiment carried out in triplicates are shown. Error bars indicate SD. Similar results were obtained in an independent experiment. (B) Target 293T cells transfected with gal5-luc and ACE2 were mixed with 293T effector cells expressing GAL-VP16 in combination with the SARS-S-protein. Effector cells transfected with empty vector (no spike) served as negative controls. Target cells were pre-incubated with PBS or the indicated concentrations of protease inhibitors before mixing with effector cells. After mixing of cells, which involved detachment and washing of cells, the inhibitors were replenished and cocultures were maintained for 48 h. Thereafter, luciferase-activities in cell lysates were determined. The results of a representative experiment carried out in triplicates are shown, cell-cell fusion measured in the absence of inhibitor was set as 100%. Error bars indicate SD. Similar results were obtained in two independent experiments. (C) 293T-hACE2 cells were incubated with the indicated inhibitors of 1 h and subsequently infected with infectivity-normalized pseudotypes bearing VSV-G or SARS-S. Luciferase activities in cell lysates were determined at 72 h post infection. The results of a representative experiment performed in triplicates are shown; error bars indicate SD. Similar results were obtained in two independent experiments.

