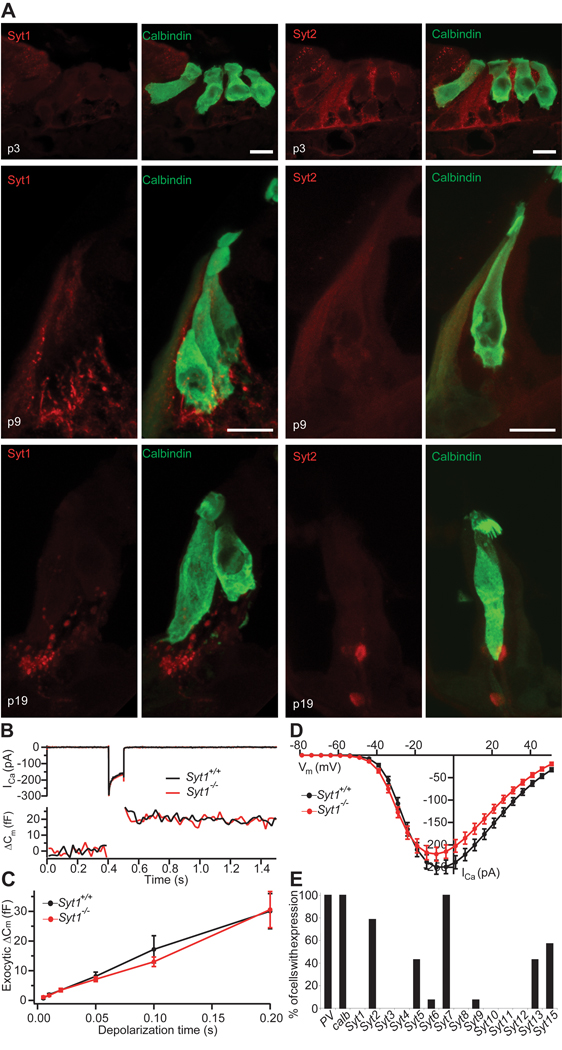
Figure 4. Syt expression analysis and presynaptic hair cell function in Syt1−/− mice.
A, projection of confocal sections of cryosectioned wild-type organs of Corti from p3 (top), p9 (middle) and p19 (bottom) immunolabeled for calbindin (hair cell marker) and Syt1 (left panels) or Syt2 (right panels). Scale bar: 10 µm.
B, representative ICa currents (top) and ΔCm (bottom) in response to 100 ms depolarization to −10 mV recorded in perforated-patch configuration from IHCs in cultures of neonatal organs of Corti from a Syt1−/− mouse and a Syt1+/+ littermate (cultured at p0, DIV 6).
C, mean ΔCm as a function of stimulus duration for Syt1+/+ (n = 22) and Syt1−/− (n = 16) IHCs recorded as in B.
D, Ca2+ current-voltage relationship of Syt1+/+ (n = 23) and Syt1−/− (n = 16) IHCs
E, Expression of 14 Syt isoforms was tested by single cell PCR in 14 IHCs from p12 rats.

