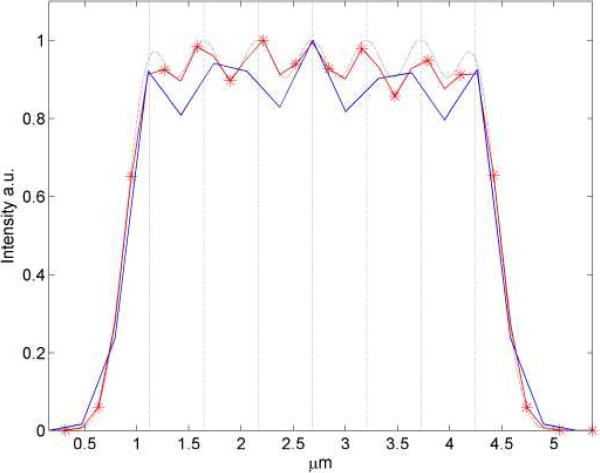
Fig. 6.
Comparison of the AC-SOFI image and XC-SOFI image. Simulation of 7 emitters (emitting at: 800 nm) placed 260 nm apart and imaged (Numerical aperture NA 1.2) on a grid which has a magnification of (160 nm/pixel). Blue line: second-order AC-SOFI image. Red line: second-order XC-SOFI image. Gray line: SOFI image as would be it obtained for a infinite spatial sampling (i.e. pixel size → 0 nm). As can be seen the XC-SOFI image carries high resolution information, which would not have been revealed in the AC-SOFI image due to the too coarse grid of the imaging system. Vertical gray lines indicate the emitter positions. Stars represent values which have been generated by cross-correlation.

