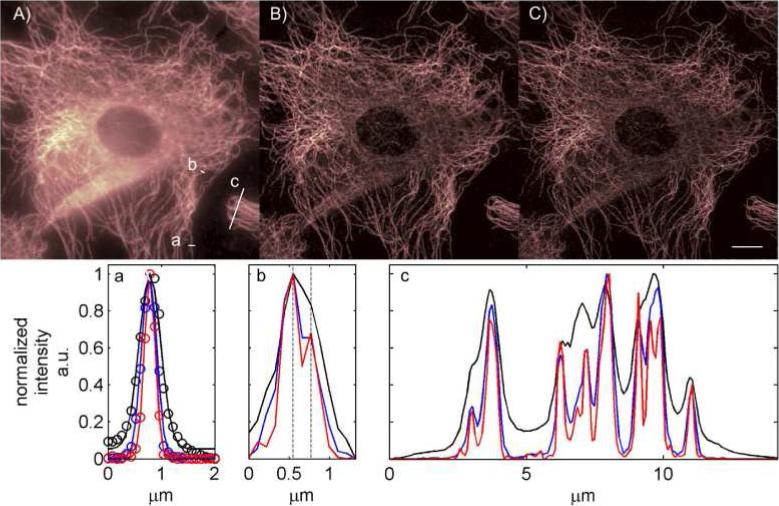
Fig. 7.
Tubulin network of a 3T3 fibroblast immuno-labeled with QD800 quantum dots. Top panel: A) original image taken from the average of 2000 frames of a wide-field microscope setup. White lines indicate locations where cross-section were taken for all images in the upper panel. B) XC-SOFI image featuring twice more pixels than the original image and a resolution enhancement of a factor of . C) Fourier-reweighted XC-SOFI image generated by using the PSF as obtained by the cross-cumulant approach. Also note that also this image has four times more pixels than the original image. Scalebar: 10 um. Lower panel: Cross-sections as taken from the upper panel. Black: interpolated original image, Blue: XC-SOFI image. Red: Fourier reweighted XC-SOFI image. a) PSF shrinks as the order increases. Lines indicating a Gauss fit and circles describe the data. The FWHM reflects the increased resolution enhancement: 1, 1.39 () and 1.98 (~2) respectively b) A structure being resolved only in the Fourier-reweighted XC-SOFI image. The distance between the peaks is 220 nm (as indicated by the dashed black lines), which is approximatley 2x smaller than the Rayleigh limit for 800 nm emitting QDs and a NA 1.2 objective. c) “zoomed-out” cross-section giving a general impression of the improvement afforded by Fourier-reweighting.

