
Figure 8. SMAC formation at immunological synapses in vivo, between T cells and infected astrocytes in the brain.
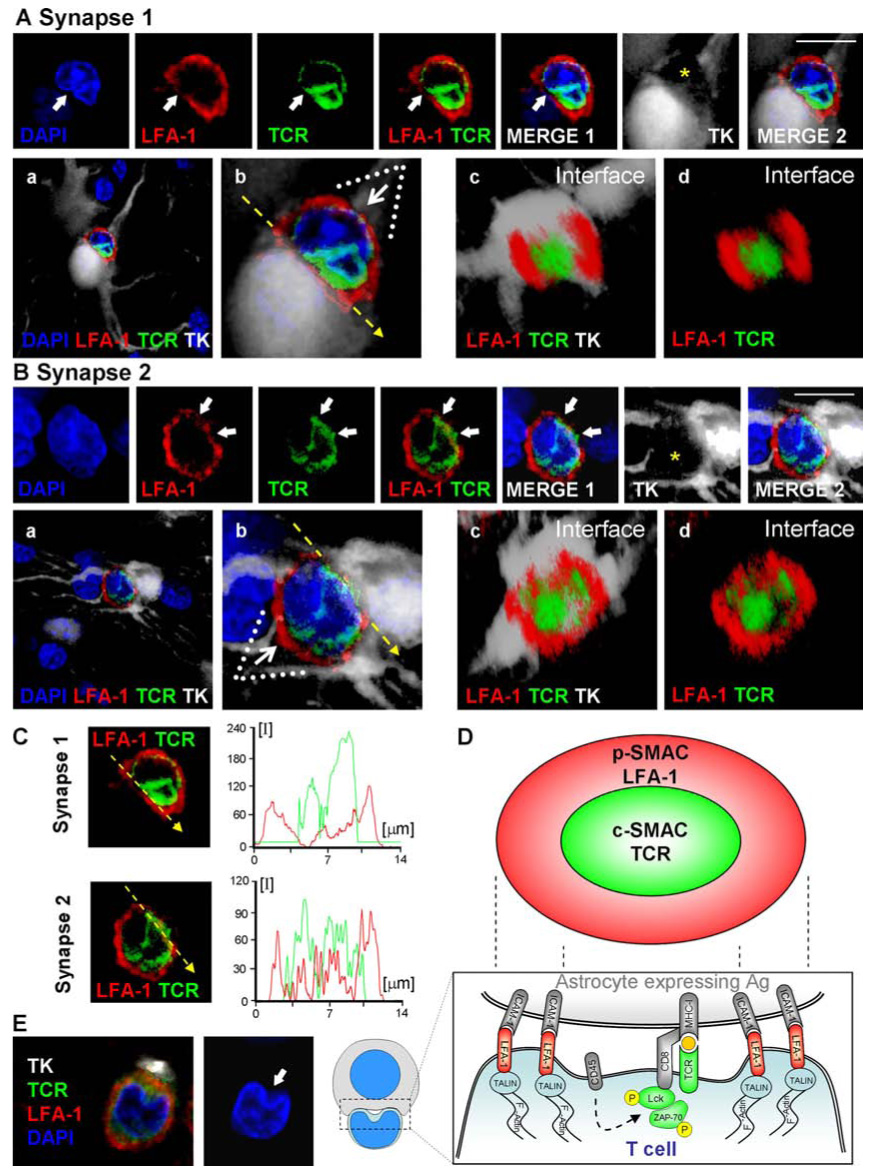
Two mature immunological synapses displaying typical and characteristic SMAC formations, are shown in A and B. The row of upper panels in A and B illustrate images captured in the given channels, from left to right: DAPI (blue), LFA-1 (red), TCR (green), LFA1+TCR, LFA1+TCR+DAPI (MERGE 1), the virally infected cell (TK; in white), and LFA1+TCR+DAPI+TK (MERGE 2). Notice that these mature immunological synapses are characterized by the specific distribution of LFA-1 and TCR contacting the virally infected cell. In the views shown in the top panels (side views of the immunological synapses), LFA-1 immunoreactivity displays high relative fluorescence density within areas of the membrane lateral to the close apposition of membranes of the lymphocyte with the infected cell, thus displaying the typical central region of lower density (see arrows in red channel) at the site of highest density of immunoreactivity for TCR (see arrows in the green channel and in the MERGE 1 and 2 images). The yellow asterisk indicates, in the white channel, the anatomical location of the T cell. The row of bottom panels in A and B illustrate, respectively, low (a) and high (b) magnifications of the close apposition between the T cell and the infected cell. These images were reconstructed using three-dimensional visualization software to illustrate the characteristic structure of the p-SMAC (LFA-1 ring) and c-SMAC (TCR cluster) at the interface of the immunological synapses seen in en face views (c and d). To produce the three-dimensional image of the interface shown in c and d, the three-dimensional reconstruction was rotated so that the plane of the interface of the immunological synapse (b, broken arrow) could be observed from above (white arrow in b shows the angle of vision of c and d). At the interface, typical “bull's eye” structures, characteristic of p-SMAC (LFA-1 outer ring) and c-SMAC (central TCR cluster) can be clearly recognized (c and d). In C, the intensity of fluorescence (I) was measured at the interface (yellow line) of the immunological synapse in a 0.5-µm confocal layer taken through the interface. The small graphs to the right of each synapse show the relative intensity values of fluorescence of LFA-1 (in red) and TCR (in green). Note the maximum of intensity for LFA-1 was in the periphery of the synapse (p-SMAC), whereas the TCR is clustered toward the center (c-SMAC). (D) A diagrammatic view of a T cell contacting an antigen-expressing astrocyte illustrating the localization of molecules involved in the immunological synapse and the polarization and phosphorylation of key tyrosine kinases. (E) A characteristic activated T cell nucleus displaying the polarized arched conformation opening toward the immunological synaptic interface. Bars, 15 µm.