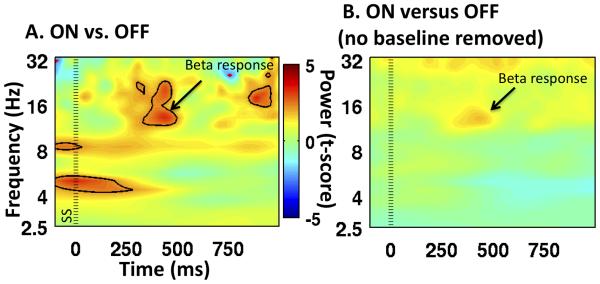
Figure 3. Time-frequency plots for stop trials for ON vs. OFF stimulation.
A. Significantly greater beta power (~16 Hz) for patients ON compared to OFF stimulation. Both conditions are first normalized to their own baselines prior to subtraction. B. The effect in panel A is still visible even when the comparison is made between ON vs. OFF without first applying a baseline correction. Power is expressed with color as a t-score. Zero ms was the time of the stop signal (SS, indicated with the standard dotted line). Power changes that are significant at p<0.05 are encircled with either a black line (for ON > OFF) or a red line (for OFF > ON).

