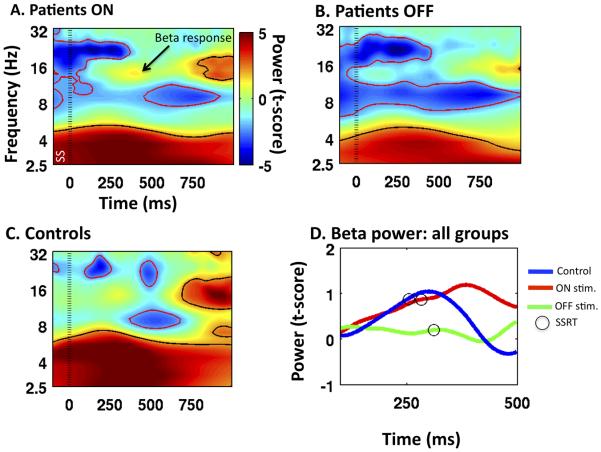
Figure 5. Time-frequency plots for stop trials.
Power expressed with color as a t-score is plotted for patients ON stimulation (A), OFF stimulation (B), and controls (C). Note the predicted response in the beta band for controls and patients ON stimulation. Zero ms was the time of the stop signal (SS, indicated with the standard dotted line). Power changes that are significant at p<0.05 are encircled with either a black line (for increases above baseline) or a red line (for decreases below baseline). D. Average beta power from 15-17 Hz using a prestimulus baseline (−500 to 0). For controls there is an increase in beta power before SSRT elapses. Patients ON stimulation show a slightly later increase consistent with a longer SSRT. There is no discernable beta increase for patients OFF stimulation

