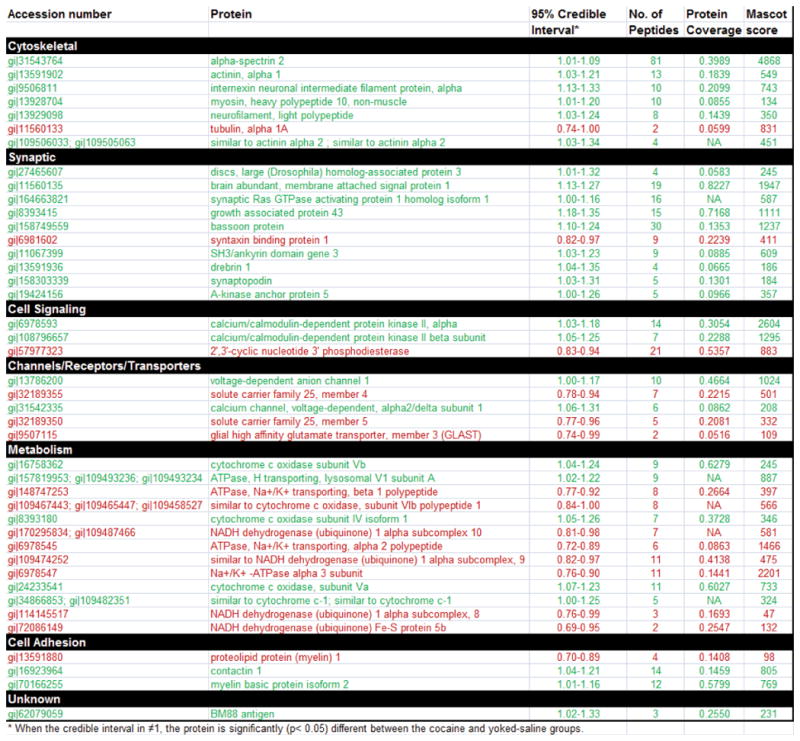
Table 1. Proteins significantly changed by cocaine self-administration and extinction.
Significantly changed proteins are indicated within groups by function. Upregulated proteins are indicated by green, downregulated proteins indicated by red. The number of peptides identified by MS/MS for each protein are indicated, as well as average percent change among identified proteins and fraction of the entire protein sequence covered by identified peptides. NaN indicated Not a Number, meaning that the protein was not found in the protein sequence file used to construct the report and so the sequence coverage could not be computed, in a case where the protein database searched by Mascot is different from that used to produce the report. Assessment of treatment dependent changes in protein expression using 95% credible intervals as described in (Hill et al., 2008) using computational methods and software described in (Schwacke et al., 2009). Mascot scores were calculated using the Mascot algorithm (Matrixscience, United Kingdom).

|
