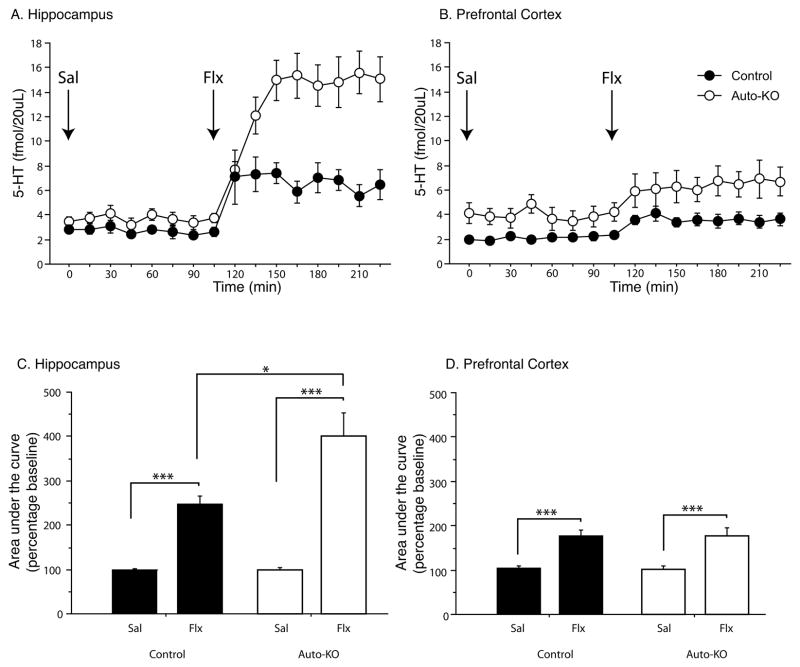
Figure 5.
(A) Extracellular serotonin levels measured by in vivo microdialysis in the vHPC (A) and PFC (B) following injection of saline (t0) and 18mg/kg fluoxetine (t105). Values are mean ± SEM for each time point. Total extracellular serotonin, measured by area under the curve analysis compared to baseline, increases in the vHPC (C) and PFC (D) of both Auto-KO and Control mice in response to acute fluoxetine treatment. Auto-KO mice display a larger percentage increase than Controls in response to fluoxetine in the vHPC but not PFC. Values are ± SEM (n=7–9 mice/group). *p<0.05, ***p<0.001.

