Figure 3.

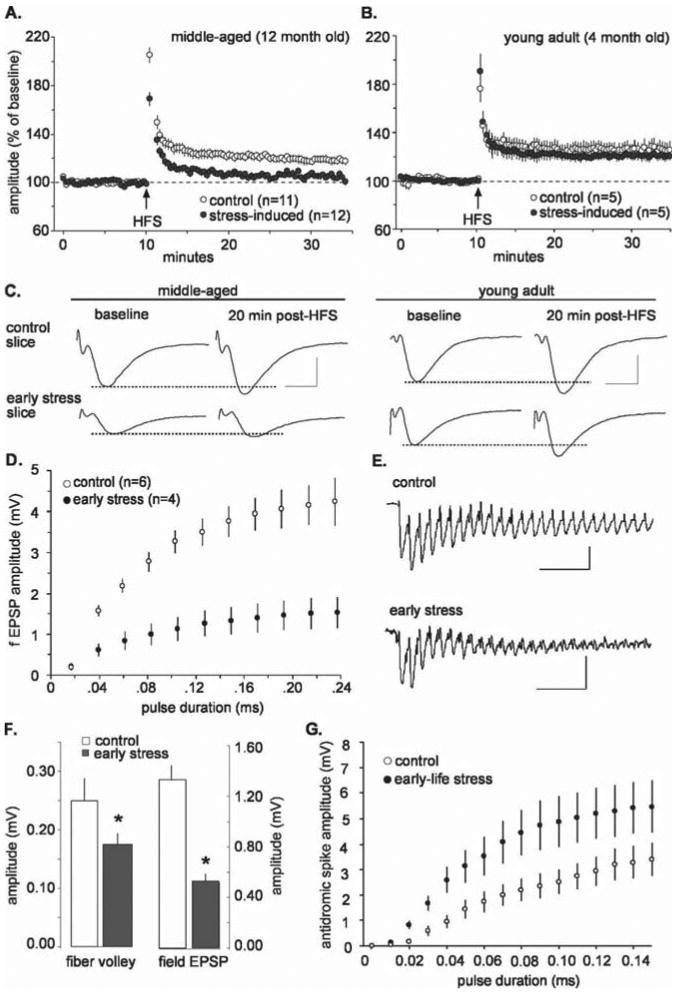
Synaptic plasticity defects and physiological abnormalities in field CA3 arise in middle-aged rats subjected to early-life stress. A, LTP in stratum radiatum of field CA3 in slices from middle-aged rats. A single HFS train was delivered at the time point indicated by the arrow. Potentiation (illustrated as percentage of average baseline field EPSP amplitude) decayed to near baseline in the stress group but not in age-matched controls (mean ± SEM). B, LTP in field CA3 of slices prepared from young adult rats. There were no evident differences between early stress and control groups 30 min after induction (p > 0.05). C, Representative EPSPs before and after HFS illustrate that LTP was deficient in the early-stress group compared with controls in slices prepared from middle-aged rats (left). There were no detectable differences between potentiated EPSPs in control and stress groups when slices were prepared from young adult rats (right). Calibration: 5 ms, 1 mV. D, Amplitude of field EPSPs in CA3 as a function of stimulus pulse duration (mean ± SEM); the input/output curves were noticeably flatter in slices from early-stress rats. E, Traces are the first 25 responses to the HFS used to induce LTP in area CA3; although initially similar, responses in the early-stress slices exhaust much more quickly than those in control slices. Calibration: 50 ms, 0.5 mV. F, In field CA3, mean amplitude of the fiber volleys (left) and evoked responses (right) were significantly reduced in early stress compared with control slices prepared from middle-aged rats (*p < 0.05). G, Input/output curves for antidromic responses in field CA3. Antidromic responses to the same stimulation currents were larger in early-stress slices compared with controls, indicating that the stress episode caused CA3 pyramidal cells to be more excitable. Error bars represent SEM.
