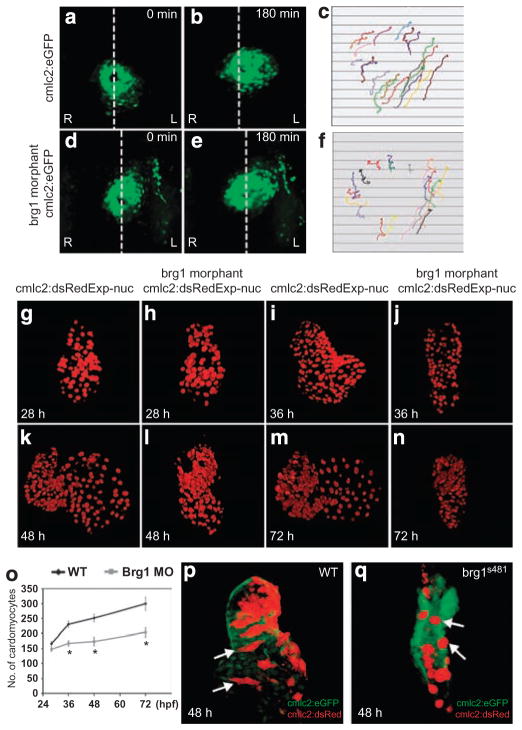
Figure 3. Defective cardiomyocyte migration and cell shape in zebrafish brg1 mutants.
(a–f) Imaging of atrial cell migration in WT embryos (a–c) and brg1 morphants (d–f). (a, b, d, e) Dorsal views of heart in Tg(cmlc2:eGFPtwu34) embryos between 18 and 21 hpf; dotted white lines indicate the embryonic midline. (c, f) Arrows of different colours indicate the trajectories of individual cells. Original magnification: ×200. (g–o) Measurement of cardiomyocyte numbers. Three-dimensional reconstructions of the nuclear DsRed signal from Tg(cmlc2:dsRedExp-nuchsc4) embryos are shown (g–n). The 28 hpf embryos (g, h) are shown in dorsal view, the 36 hpf (i, j), 48 hpf (k, l) and 72 hpf (m, n) embryos are shown in anterior views. (o) Quantitation of cardiomyocyte cell numbers. Data are mean ± s.d., n = 5–8 embryos; *P < 0.05 by t-test. Original magnification: ×400. (p, q) Three-dimensional assessment of cell morphologies in Tg(cmlc2:eGFPtwu34)-expressing hearts that exhibit mosaic expression of Tg(cmlc2:dsRedExp-nuchsc4). Arrows point to representative cells. (p) WT cells transplanted; (q) brg1s481 cells transplanted. Original magnification: ×400. A, atrium; L, left; R, right; V, ventricle.

