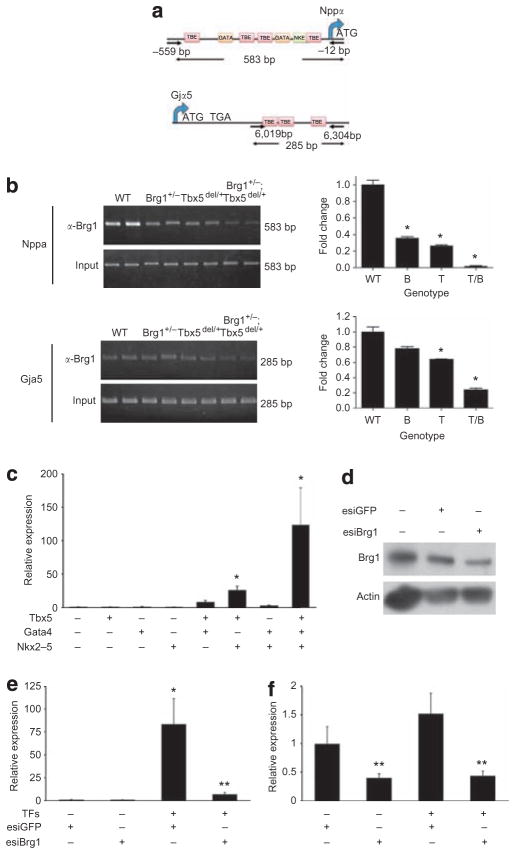
Figure 7. Direct interactions between Brg1 and cardiac transcription factors.
(a) Diagram indicating the location of primer pairs for amplification of immunoprecipitated chromatin-associated DNA for Nppa and Gja5. Locations of conserved T-box-binding elements (TBE), GATA factor-binding sites (GATA) and Nkx2–5-binding sites (NKE) are shown. ATG: start codon; TGA: translational stop codon. Nucleotide positions shown are relative to start codon. (b) ChIP of Brg1 at the Nppa or Gja5 promoters from E9.5 hearts of the indicated genotypes. On the left are EtBr-stained gels showing amplification, and quantitation by QPCR is shown in the graphs on the right. Data are mean ± s.e.; n = 3; *P < 0.05. (c) Quantitation of Nppa mRNA in NIH3T3 fibroblasts transfected with combinations of Tbx5, Nkx2–5 and Gata4. Data are mean ± s.e.; n = 3; *P < 0.05 versus mock transfection. (d) Western blot to measure reduction of Brg1 protein levels by anti-Brg1 esiRNAs. Actin is a loading control. (e) Quantitation of Nppa mRNA in NIH3T3 fibroblasts transfected with Tbx5, Nkx2–5 and Gata4, with or without esiRNAs targeting Brg1, or control esiRNAs. TFs = Tbx5, Gata4 and Nkx2–5. Data are mean ± s.e.; n = 3; *P < 0.05 versus mock transfection; **P < 0.05 esiBrg1 + versus esiBrg1 −. (f) Brg1 mRNA levels in the same samples as in c. Data are mean ± s.e.; n = 3; **P < 0.05 esiBrg1 + versus esiBrg1 −.

