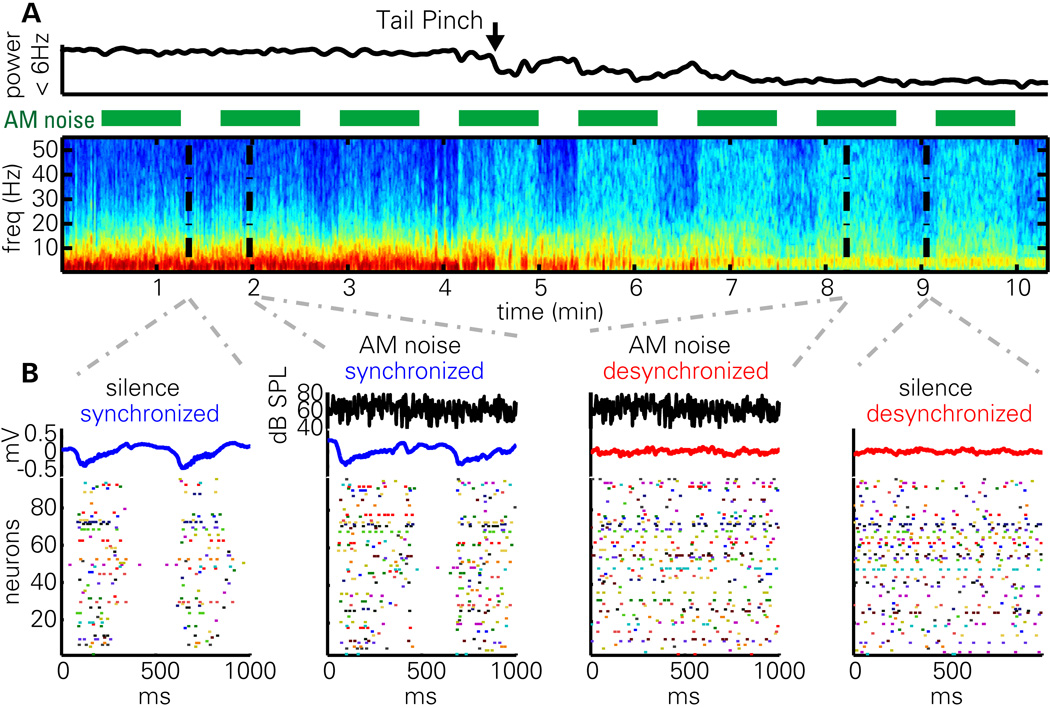
Figure 1. AM noise presentation in synchronized and desynchronized states.
(A) LFP power spectrogram and integrated power in 0–6 Hz band during a synchronized to desynchronized state transition following tail pinch. Green bars denote presentation of frozen AM noise stimuli. Note that low frequency power is generally reduced in the desynchronized state, with the exception of an ~4 Hz oscillation presumably reflecting volume-conducted hippocampal theta. Also note that stimulus presentation induces high frequency LFP power more prominently in the desynchronized state.
(B) 1 s epochs of activity during silence and stimulus presentation. Black traces denote noise envelope (for epochs during stimulus presentation); blue and red traces denote LFP; rasters show activity of a simultaneously recorded population of neurons. Note that the structure of population activity is highly dependent on brain state, but not strongly affected by sustained portions of the stimulus presentation.

