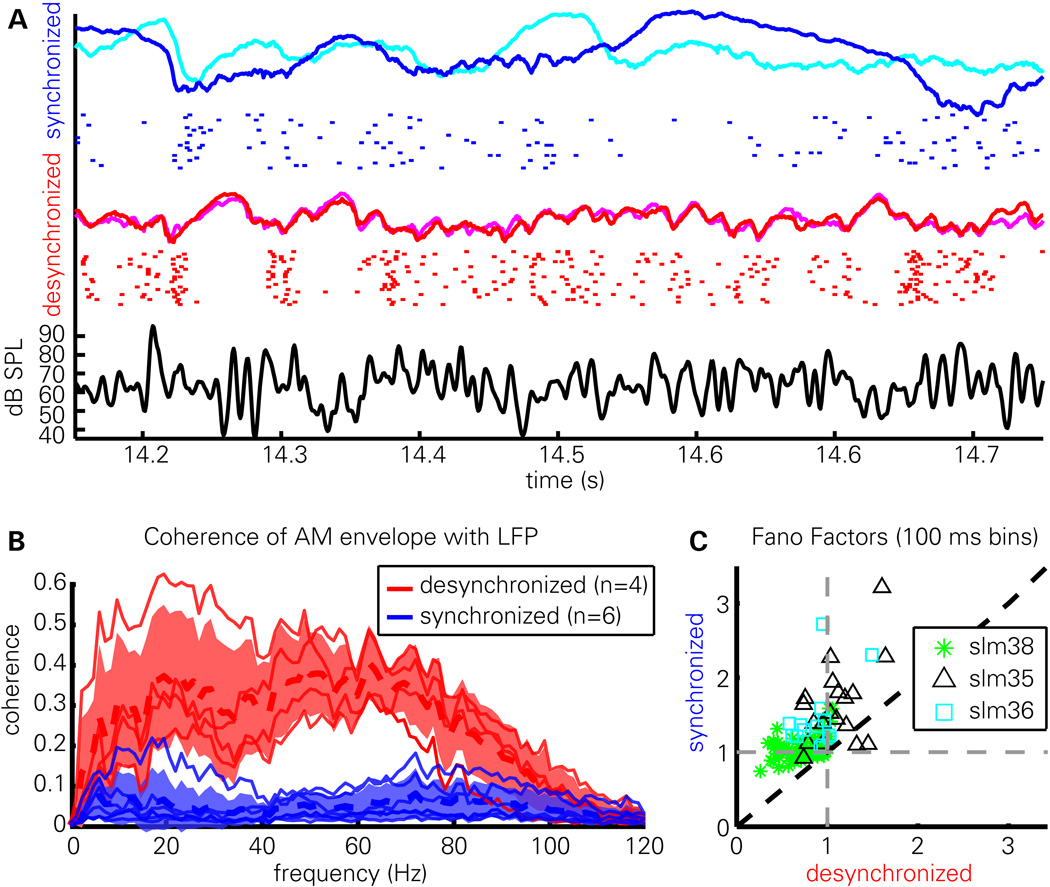
Figure 2. Reliability of cortical responses varies with brain state.
(A) Evoked LFPs (colored curves) from two presentations of the same AM noise snippet in desynchronized (red, magenta) and synchronized (blue, cyan) states, as well as raster representation of spikes from one cell in response to 22 repeated presentations in each state. Black curve (bottom) shows stimulus envelope. Note that both the LFP and spiking pattern is more reliable in the desynchronized state.
(B) Coherence (phase correlation) between the evoked LFPs and the AM noise envelope, measured in 6 animals (of which 4 showed sufficient desynchronized activity to enable accurate computation). Thin red and blue lines correspond to individual experiments; thick dashed lines represent the mean, shaded area indicates mean ± standard deviation across experiments.
(C) Fano factors quantifying the variability with which each cell responded to repeats of the stimulus in each state. The stimulus period was divided into successive 100 ms bins, a Fano factor computed for each, and averaged. Note that synchronized state Fano factors are typically greater (less) than 1 in the synchronized (desynchronized) state indicating supra- (sub-) Poisson variability.

