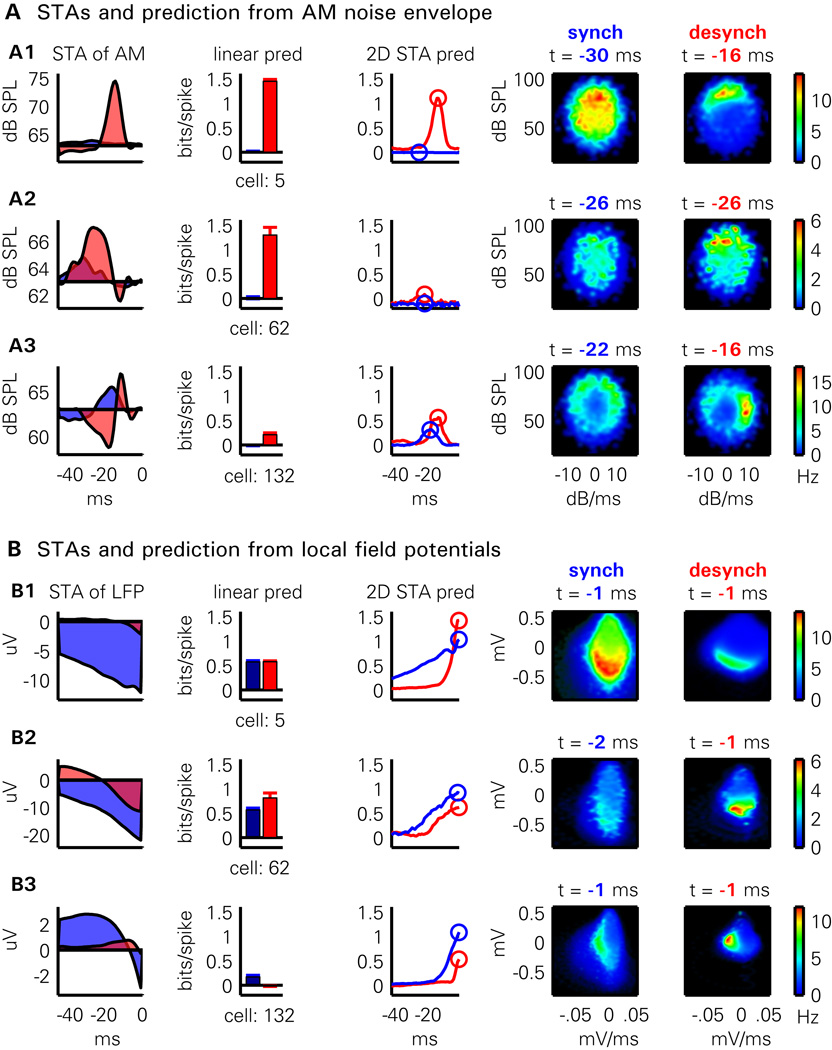
Figure 4. Example of the prediction methods for three illustrative neurons.
(A) Each row shows the prediction method applied to one neuron from the AM noise envelope. From left to right: the linear spike triggered average of the noise envelope in the desynchronized (red shading) and synchronized (blue shading) states; predictability for the cell assessed by the linear STA method for desynchronized (red bar) and synchronized (blue bar) states; predictability with the 2D STA method as a function of time offset in each state (red and blue curves); 2D STA plots for synchronized state for optimal time offset; 2D STA plots for desynchronized state for optimal time offset.
(B) Same plots as in (A), showing prediction of the same three cells from LFP. For further discussion of the plots, see text.

