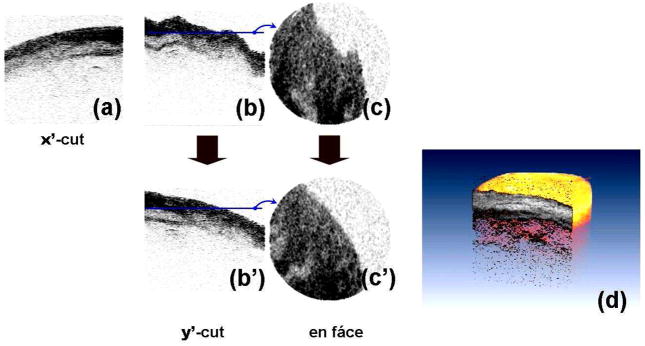
Fig. 11.
OCT image cut along the X′ axis (a), Y′-cut image (b), and the en face image (c) before the motion compensation, along with the motion-corrected versions of the Y′-cut image (b′), en face image (c′) and the 3D-rendered tomogram (d). The sample was a pig’s larynx ex vivo. Images show the trachea.

