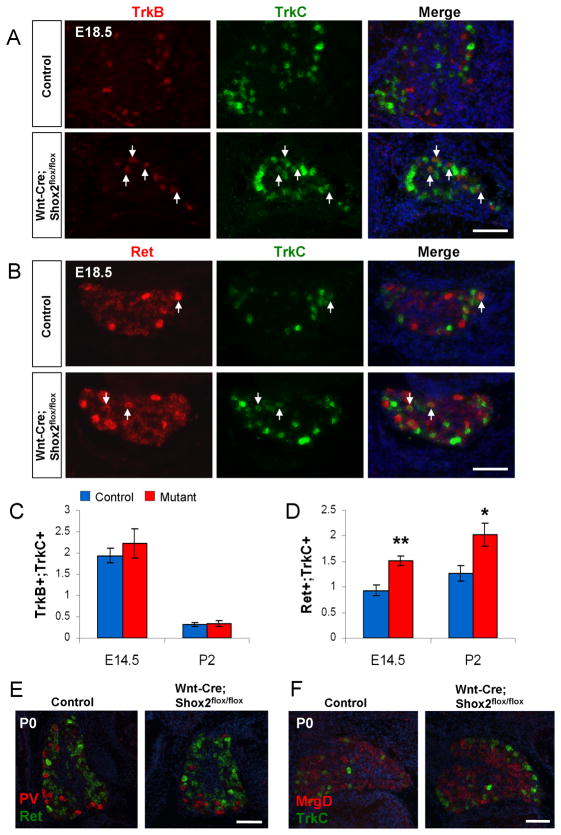
Figure 5. Increased co-expression of Ret and TrkC in DRG neurons in Wnt1-Cre; Shox2flox/flox mice.
A. Representative results of two-color in situ hybridization using TrkB (red) and TrkC (green) probes at E18.5. Arrows indicate neurons in the DRG that are positive for both receptors. B. Representative results of two-color in situ hybridization using Ret (red) and TrkC (green) probes at E18.5. Arrows indicate cell bodies in the DRG that are positive for both receptors. C. Quantification of the average number (per unit area) of TrkB/TrkC double positive neurons revealed no significant difference between the control and Shox2-deleted mice. D. Quantification of the average number (per unit area) of Ret/TrkC double positive neurons showed a significant increase in the Shox2-deleted verses control DRG. E. Representative images of two color in situ hybridization results with Parvalbumin (red) and Ret (green) probes at P0. F. Representative images of two color in situ hybridization results with MrgD (red) and TrkC (green) probes at P0. *p<0.01 and **p<0.001. Scale bar = 100μm.

