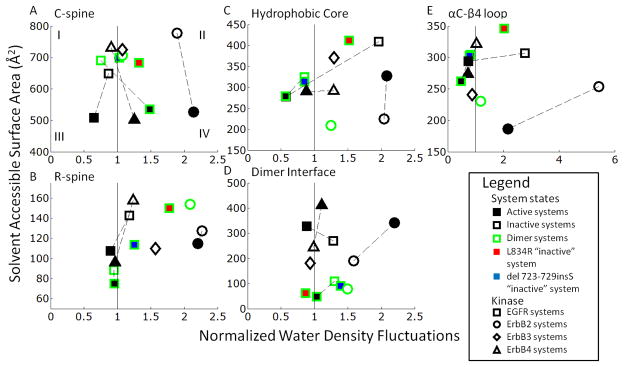
Figure 4.
Hydrophobic plots of the solvent accessible surface area (SASA) versus normalized water density fluctuations in the key hydrophobic regions of the ErbB kinases: (A) C-spine; (B) R-spine; (C) Hydrophobic Core; (D) Dimer Interface; and (E) αC-β4 loop. The edge colors represent monomer (black) and dimer (green) systems. The shape internal color represents active (black) and inactive (white) for the wildtype systems. The mutant systems of EGFR L834R in the inactive conformation are red while the EGFR del 728–729insS mutant system is blue. The shape itself represents a different member of the ErbB family EGFR (square), ErbB2 (circle) and ErbB4 (triangle). The quadrants represent different hydrophobic interaction regions (I) hydrophilically favorable region, (II) perturbation-sensitive region and (IV) hydrophobically favorable region. It is not clear if quadrant III represents a favorable or unfavorable region as it represents a buried hydrophilic surface.

