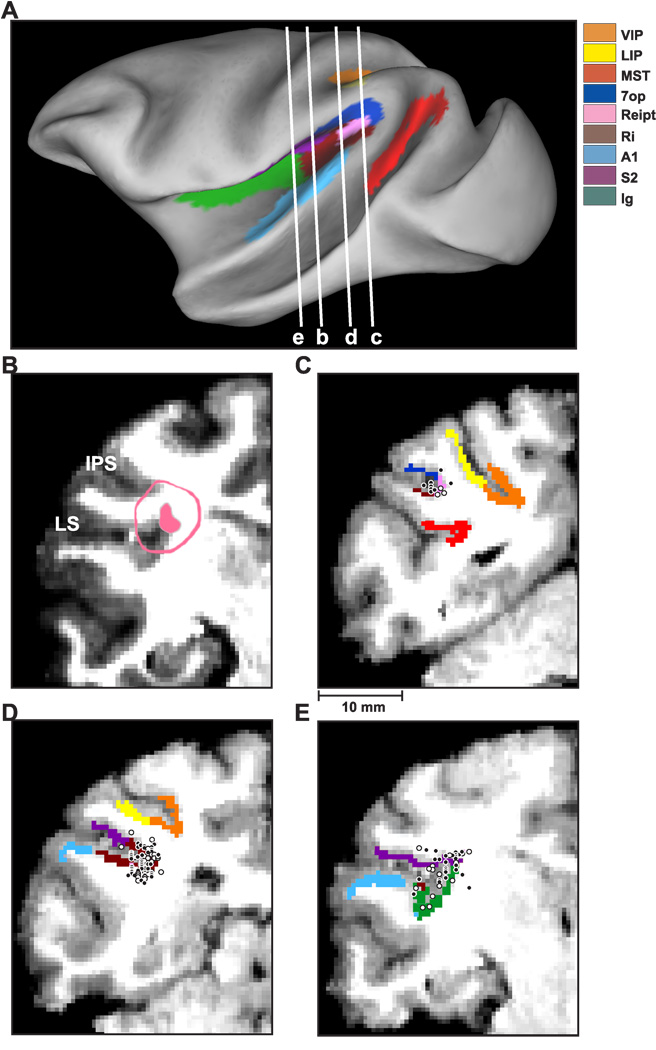
Figure 1.
Anatomical localization of recording sites in the left hemisphere of monkey U. (A) Inflated cortical surface illustrating the coronal sections drawn in B–E. (B) A coronal MRI image showing portions of the lateral sulcus (LS) and intraparietal sulcus (IPS). The filled pink region shows the dense core of signal produced by a manganese injection into the upper bank of the lateral sulcus, at a location where vestibular responses were identified physiologically. The outer pink contour shows the boundaries of the ‘halo’ of less intense signal surrounding the injection. Manganese-induced responses have been superimposed on the baseline MRI image for this animal (see Methods). (C)–(E) Coronal sections, spaced 4mm apart, are shown from posterior (C) to anterior (E); cells located within 2 mm of each section were projected onto that section. Filled symbols with white borders represent single units that showed clear responses during sinusoidal translation and/or rotation, whereas open symbols with black borders illustrate cells that showed no response.

