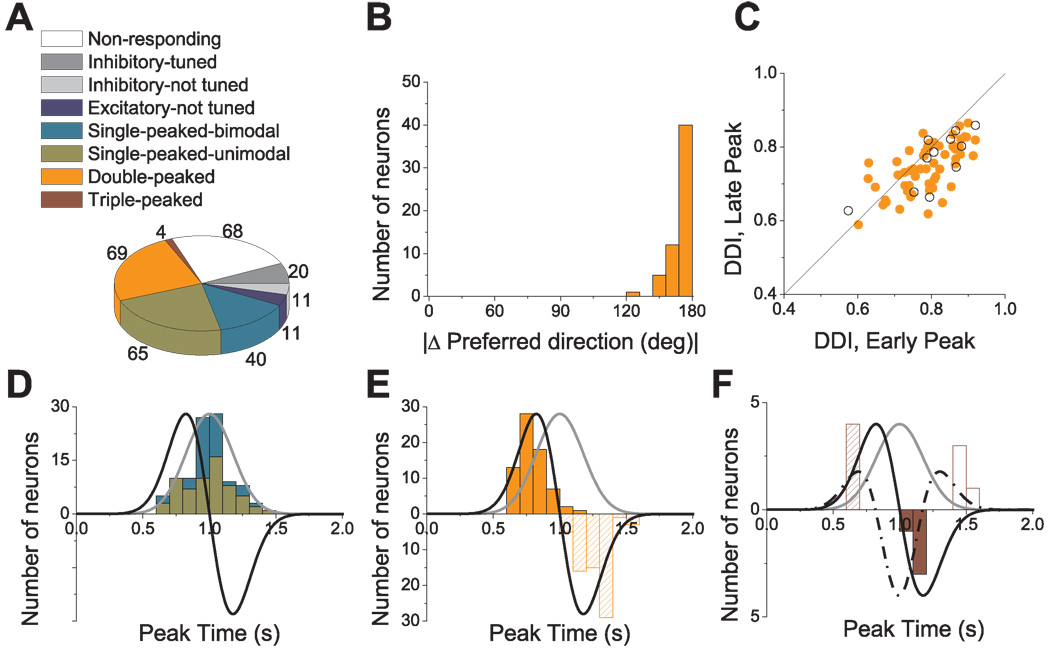
Figure 11.
Population summary of the spatio-temporal tuning in response to transient 3D translation. (A) Categories of tuning among responsive cells (n=220). (B) Distribution of the 3D difference in preferred direction (|Δ Preferred direction|) between the two distinct spatial tuning peaks of double-peaked cells; data are shown for 58/69 double-peaked cells with direction tuning that was unimodal at both peak times. (C) Scatter plot of the direction discrimination index (DDI) characterizing the strength of directional tuning at the two peak times of double-peaked cells. Filled symbols represent cells with unimodal spatial tuning for both peak times (n=58). Open symbols represent cells with bimodal spatial tuning for at least one of the peak times (n=11). (D) Distribution of peak times for single-peaked cells. Green bars: cells with unimodal spatial tuning (n=65); Cyan bars: cells with bimodal spatial tuning (n=40). (E) Distribution of peak times for double-peaked cells (n=69). Solid and hatched bars indicate the first and second peak times, respectively. (F) Distribution of peak times for triple-peaked cells (n=4). Stimulus velocity (gray), acceleration (black) and jerk (dashed-dotted line) profiles are overlaid in D–F. Distributions of the second peak times for double-peaked and triple-peaked cells have reversed polarity (negative ordinate values) for illustrative purposes.

