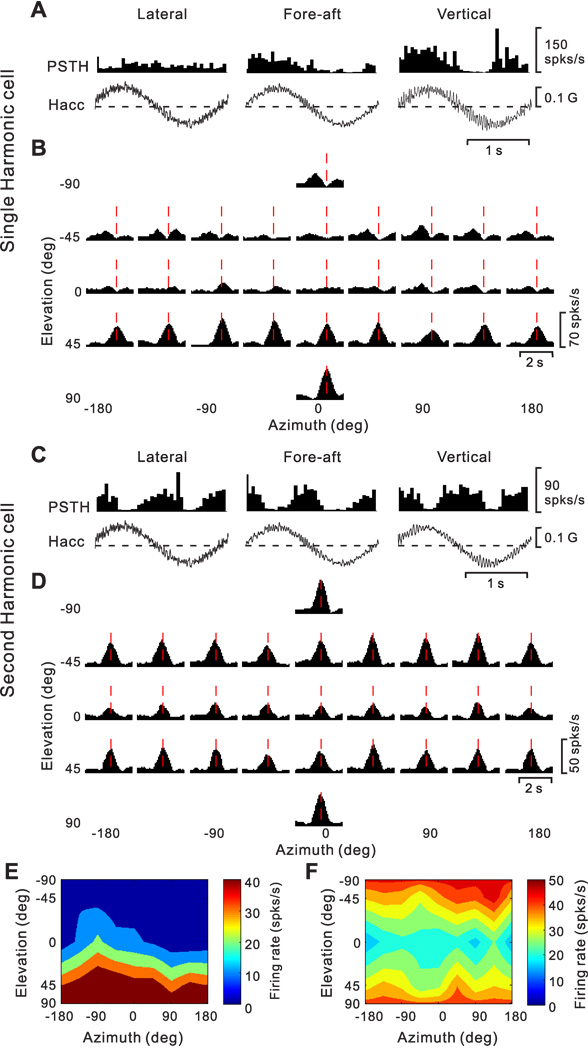
Figure 12.
Examples of cells with first harmonic (A, B, E) and second harmonic (C, D, F) responses, as tested during both sinusoidal and 3D transient translation protocols. (A) Average response PSTHs of a double-peaked cell during sinusoidal translation (0.5 Hz); the cell modulated during fore-aft (198.4 spikes/s/G, p_f1<0.01, p_f2>0.01, f2/f1=0.2, middle) and up-down (250 spikes/s/G, p_f1<0.01, p_f2>0.01, f2/f1=0.4, right), but not lateral motion (p_f1>0.01, p_f2>0.01, left). Hacc: Head acceleration. (B) Average response PSTHs during transient translation of the same double-peaked cell; red lines indicate the second peak time (1.2 s) when the maximum response across all directions occurred. (C) Average PSTHs of a second harmonic cell, responding to all directions of sinusoidal translation, lateral (p_f1>0.01, p_f2<0.01, f2/f1=4.9), fore-aft (p_f1>0.01, p_f2<0.01, f2/f1=4.6), and up-down (p_f1>0.01, p_f2<0.01, f2/f1=3.1). (D) Average response PSTHs for transient stimuli, showing significant temporal modulation along most (21/26) directions. Vertical red lines illustrate peak time (0.96 s). (E) Color contour map showing 3D tuning for the second peak time (DDI=0.84) for the cell shown in A, B. The cell’s tuning was unimodal (p_uni>0.05, modality test), with a preferred direction at azimuth −83.9° and elevation 76.9°.The spatial tuning for the first peak time (not shown) was also unimodal (DDI=0.78), with a preferred direction at azimuth 11.6° and elevation −53.8°. (F) Color contour map showing 3D spatial tuning at peak time for the 2nd harmonic cell shown in C, D; tuning was spatially bimodal (DDI=0.72).

